Timeline
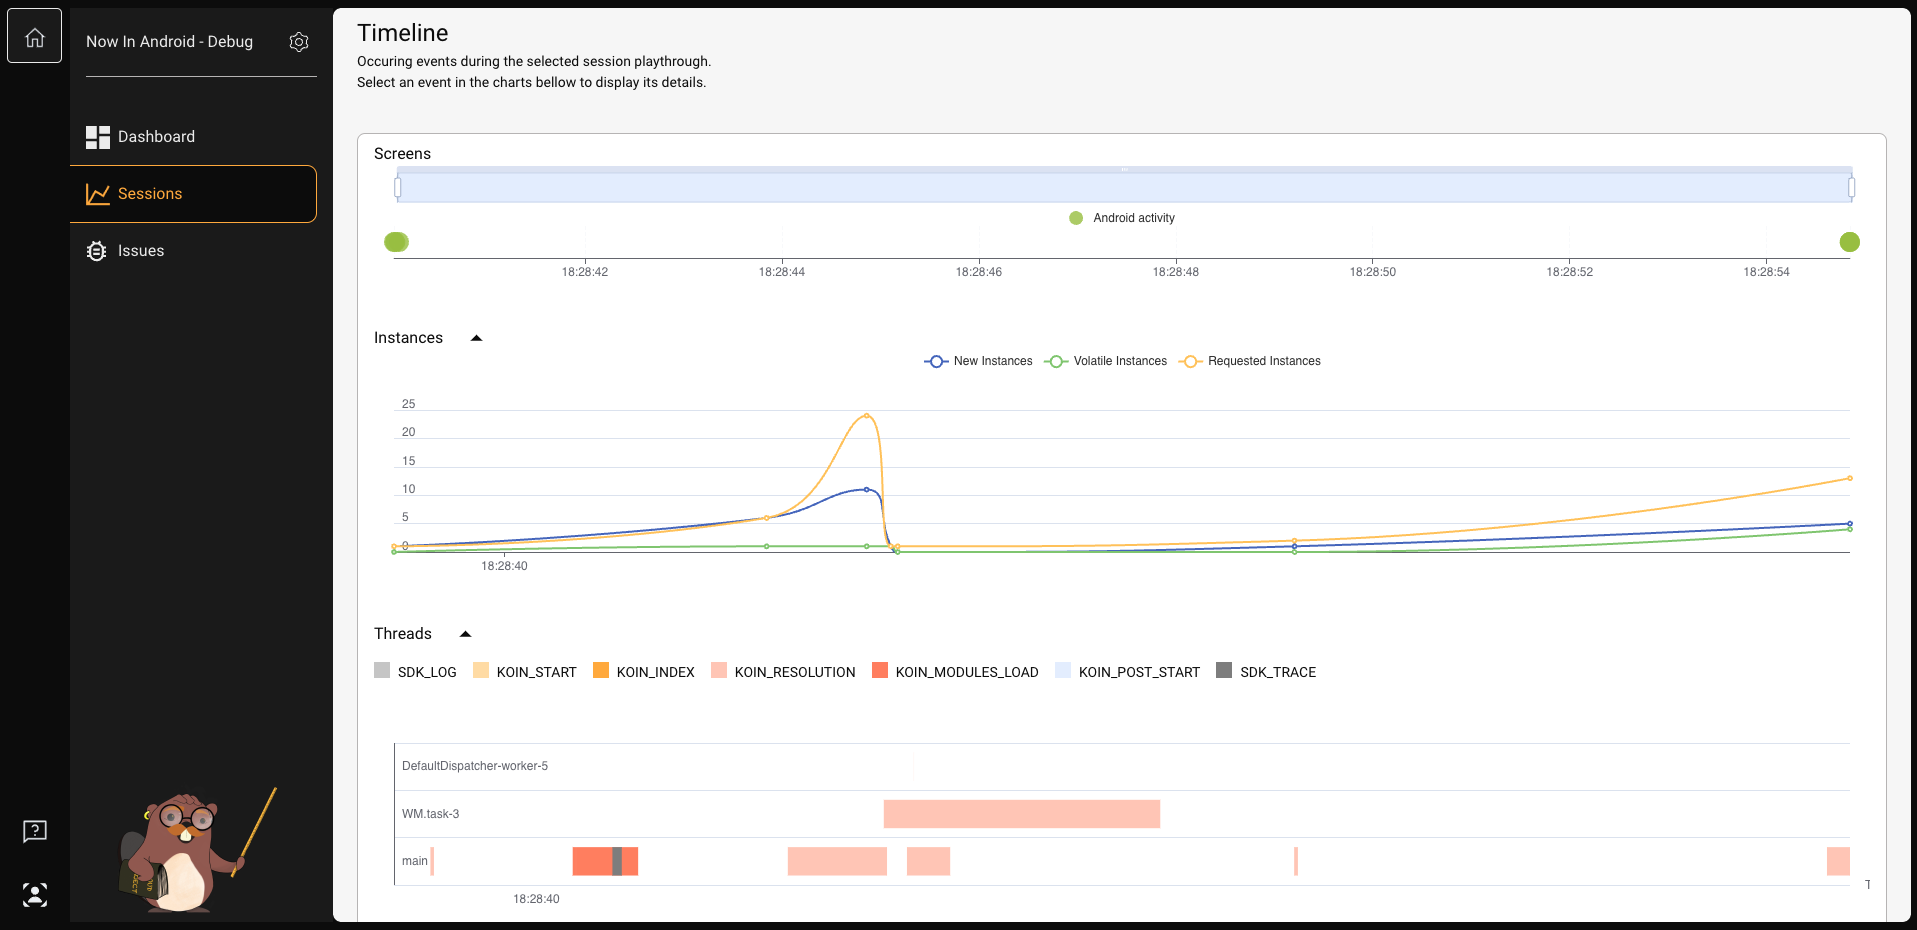
The Timeline in Kotzilla Platform offers an innovative view, providing visualisation & insights into the app components lifedycle and dependencies:
-
Screen navigation flow: shows visibility into how users navigate through different screens, including insights into the states of each screen. You can detect any abnormal sequences in the flow of screen states.
-
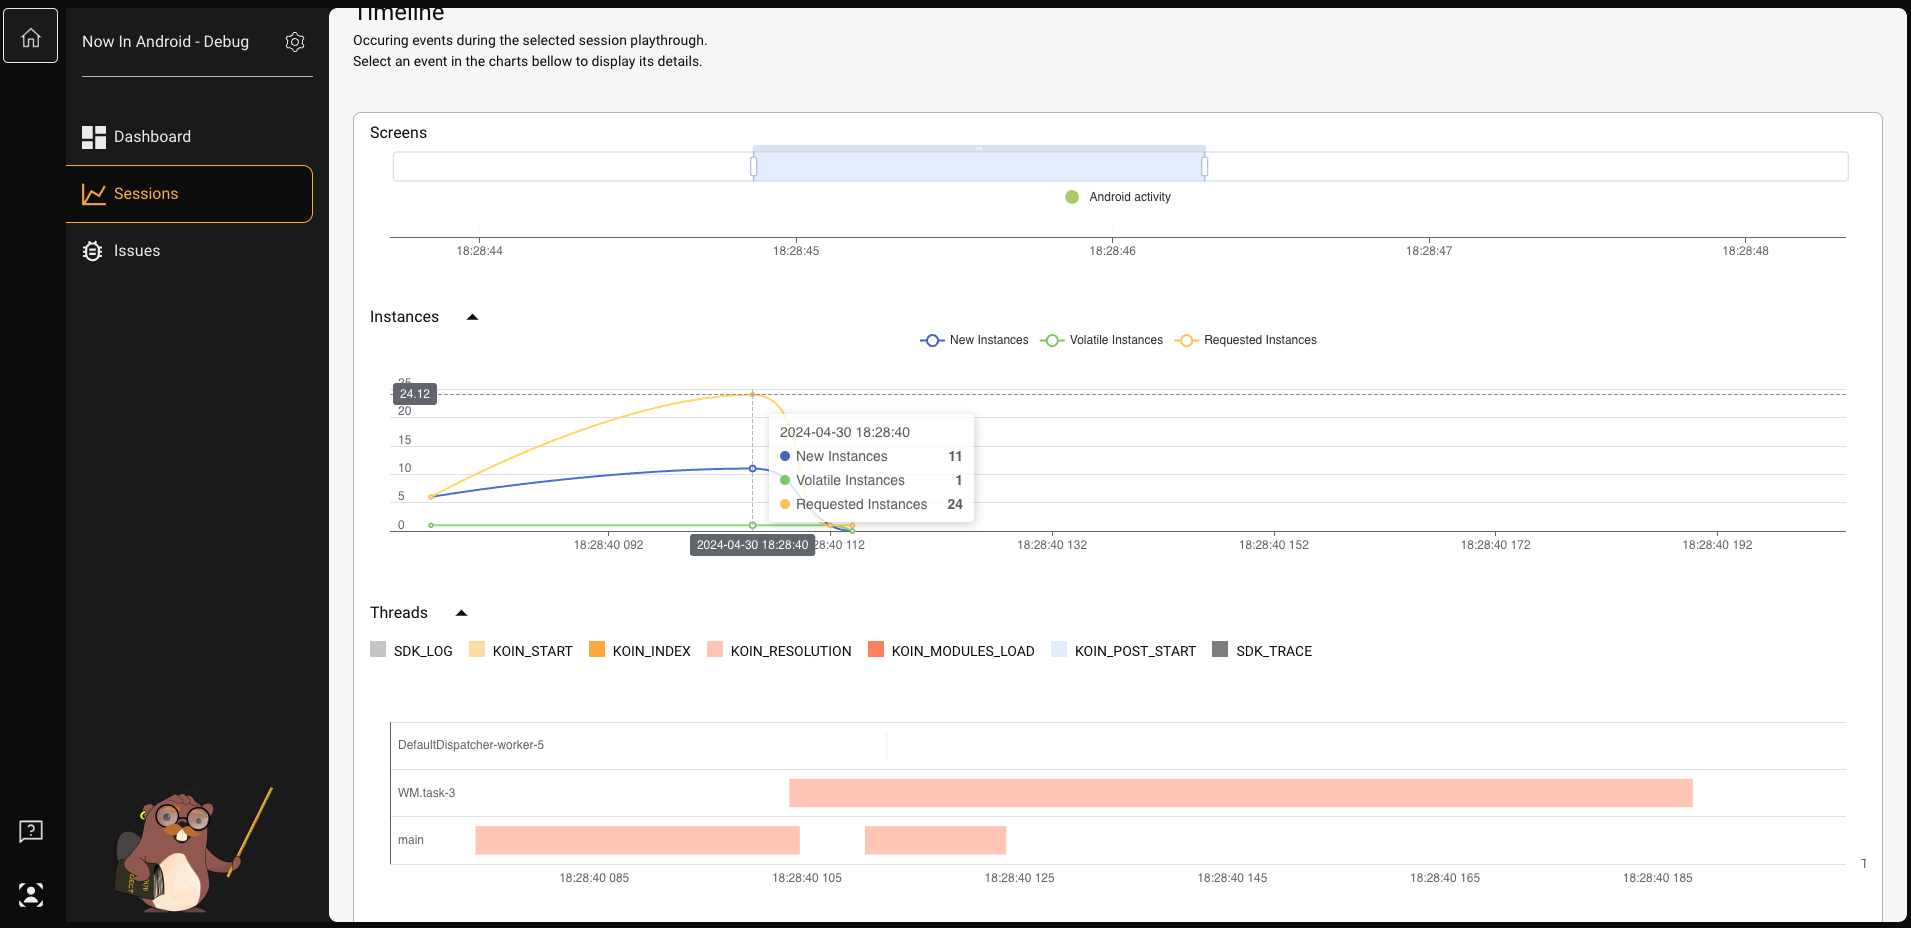
Instances in the context of a particular session: provides information about "New Instances" (instances created during the session), "Volatile Instances" (instances that need to be recreated each time the session is initiated), as well as "Requested Instances" (instances dependencies). Those insights helps optimize resource management and identify potential memory leaks and/or performance issues.
-
Details of all the threads created in this session: dive deep into the activity details of each thread generated during the session. This includes comprehensive information about thread activity, enabling you to pinpoint performance bottlenecks, optimize thread usage, and enhance overall application responsiveness to anticipate ANR's

The Timeline view includes a user-friendly functionality that allows you to adjust the scale of the timeline and select the period of time they want to analyze, providing granularity in data analysis.

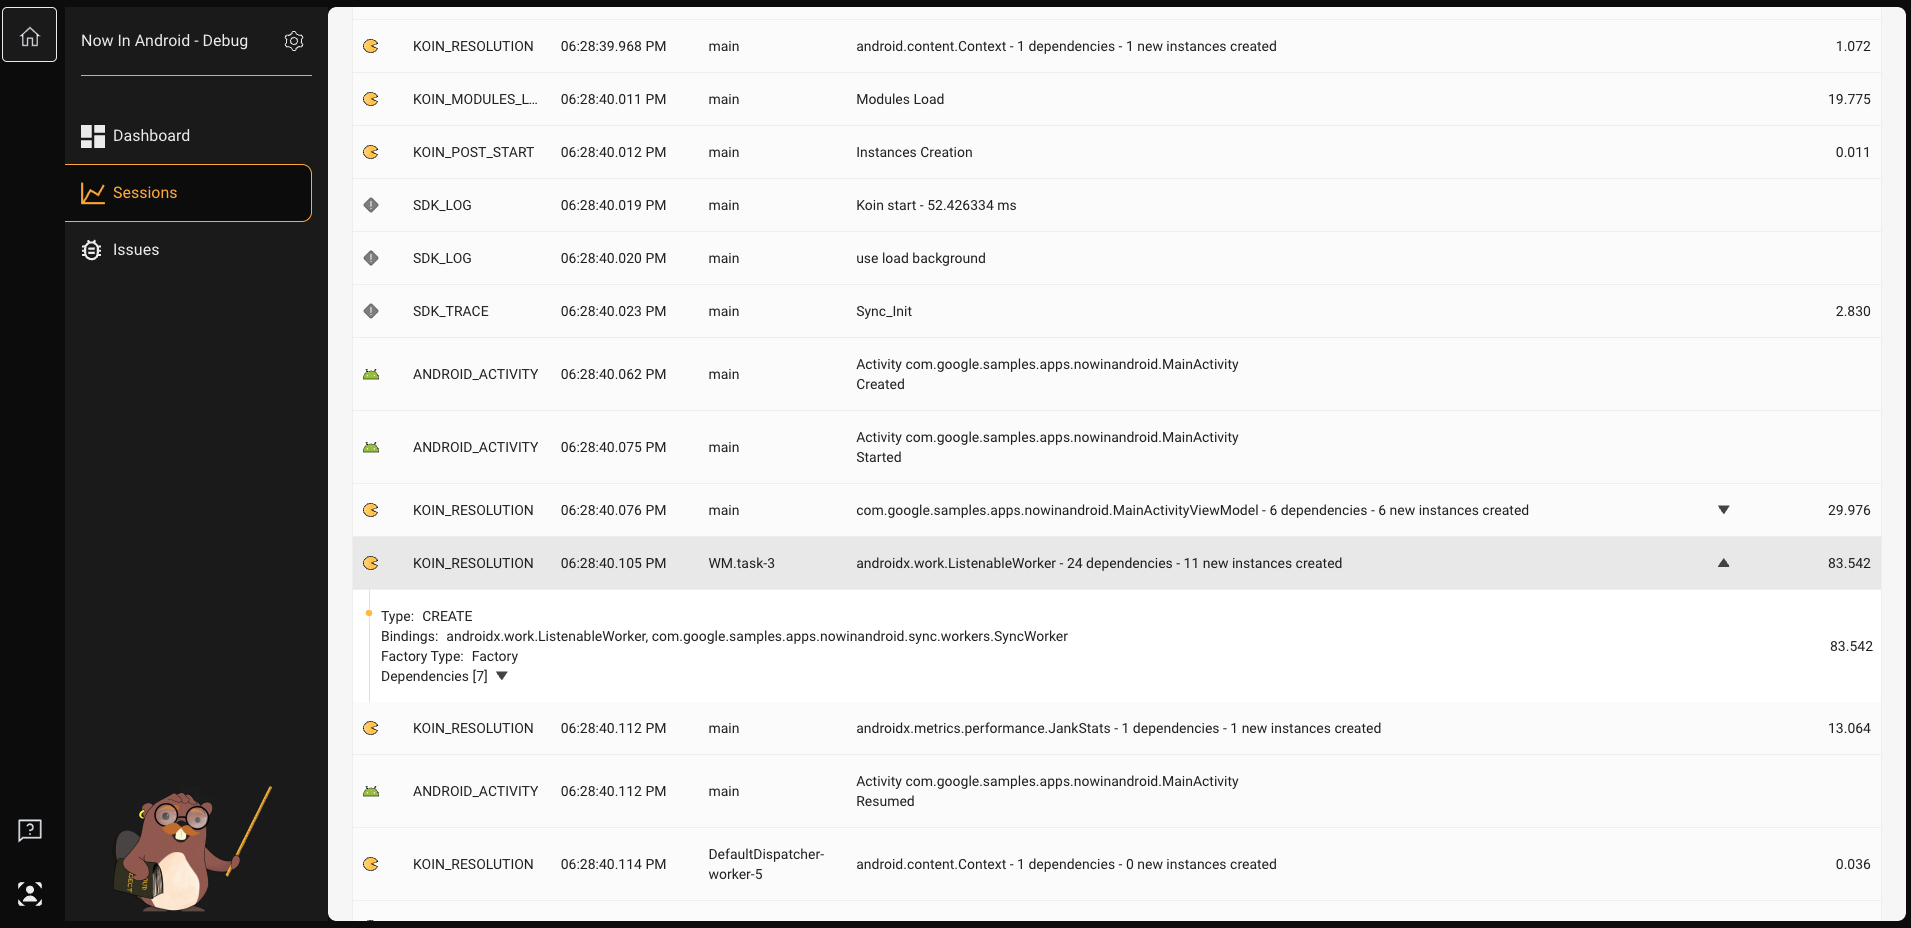
By clicking on either the Instance or Threads sections, you get access more detailed information about the list of events correlated to this particular activity. Examining these events provides insights into the execution flow and resource utilization, enabling you to pinpoint areas for optimization and enhancement.
