Kotzilla Console
The Kotzilla Console is a web-based platform that helps you monitor, analyze, and fix performance and stability issues in your Kotlin and Kotlin Multiplatform (KMP) applications. It connects business-impact metrics (crash rates, startup times, slow screens) with the detected issues and root causes behind them, so you can prioritize what matters most to your users.
How the Console works
The Console gives you two complementary paths to investigate app performance:
- Start from the Dashboard - Get a global view of your app's health, stability, and startup performance. Identify which KPIs are degrading and which screens are slow, then drill down into the underlying issues.
- Start from Issues - Browse all detected issues, sorted by severity and user impact. From any issue, see which screens and sessions are affected.
Both paths connect: a slow screen links to the blocking components and issues causing it, while an issue links back to the impacted screens and sessions. This means you can move freely between the screen perspective and the issue perspective depending on how you prefer to investigate.
Once you identify the root cause, AI-powered contextual prompts help you generate fixes directly from any view in the Console.
Automatic issue detection
The Kotzilla Console automatically detects and surfaces critical issues without requiring any additional instrumentation of your code. Using the Kotzilla SDK, it identifies the following types of issues:
- Cold and warm startup issues - Delays in app initialization, preventing the first usable screen from appearing quickly.
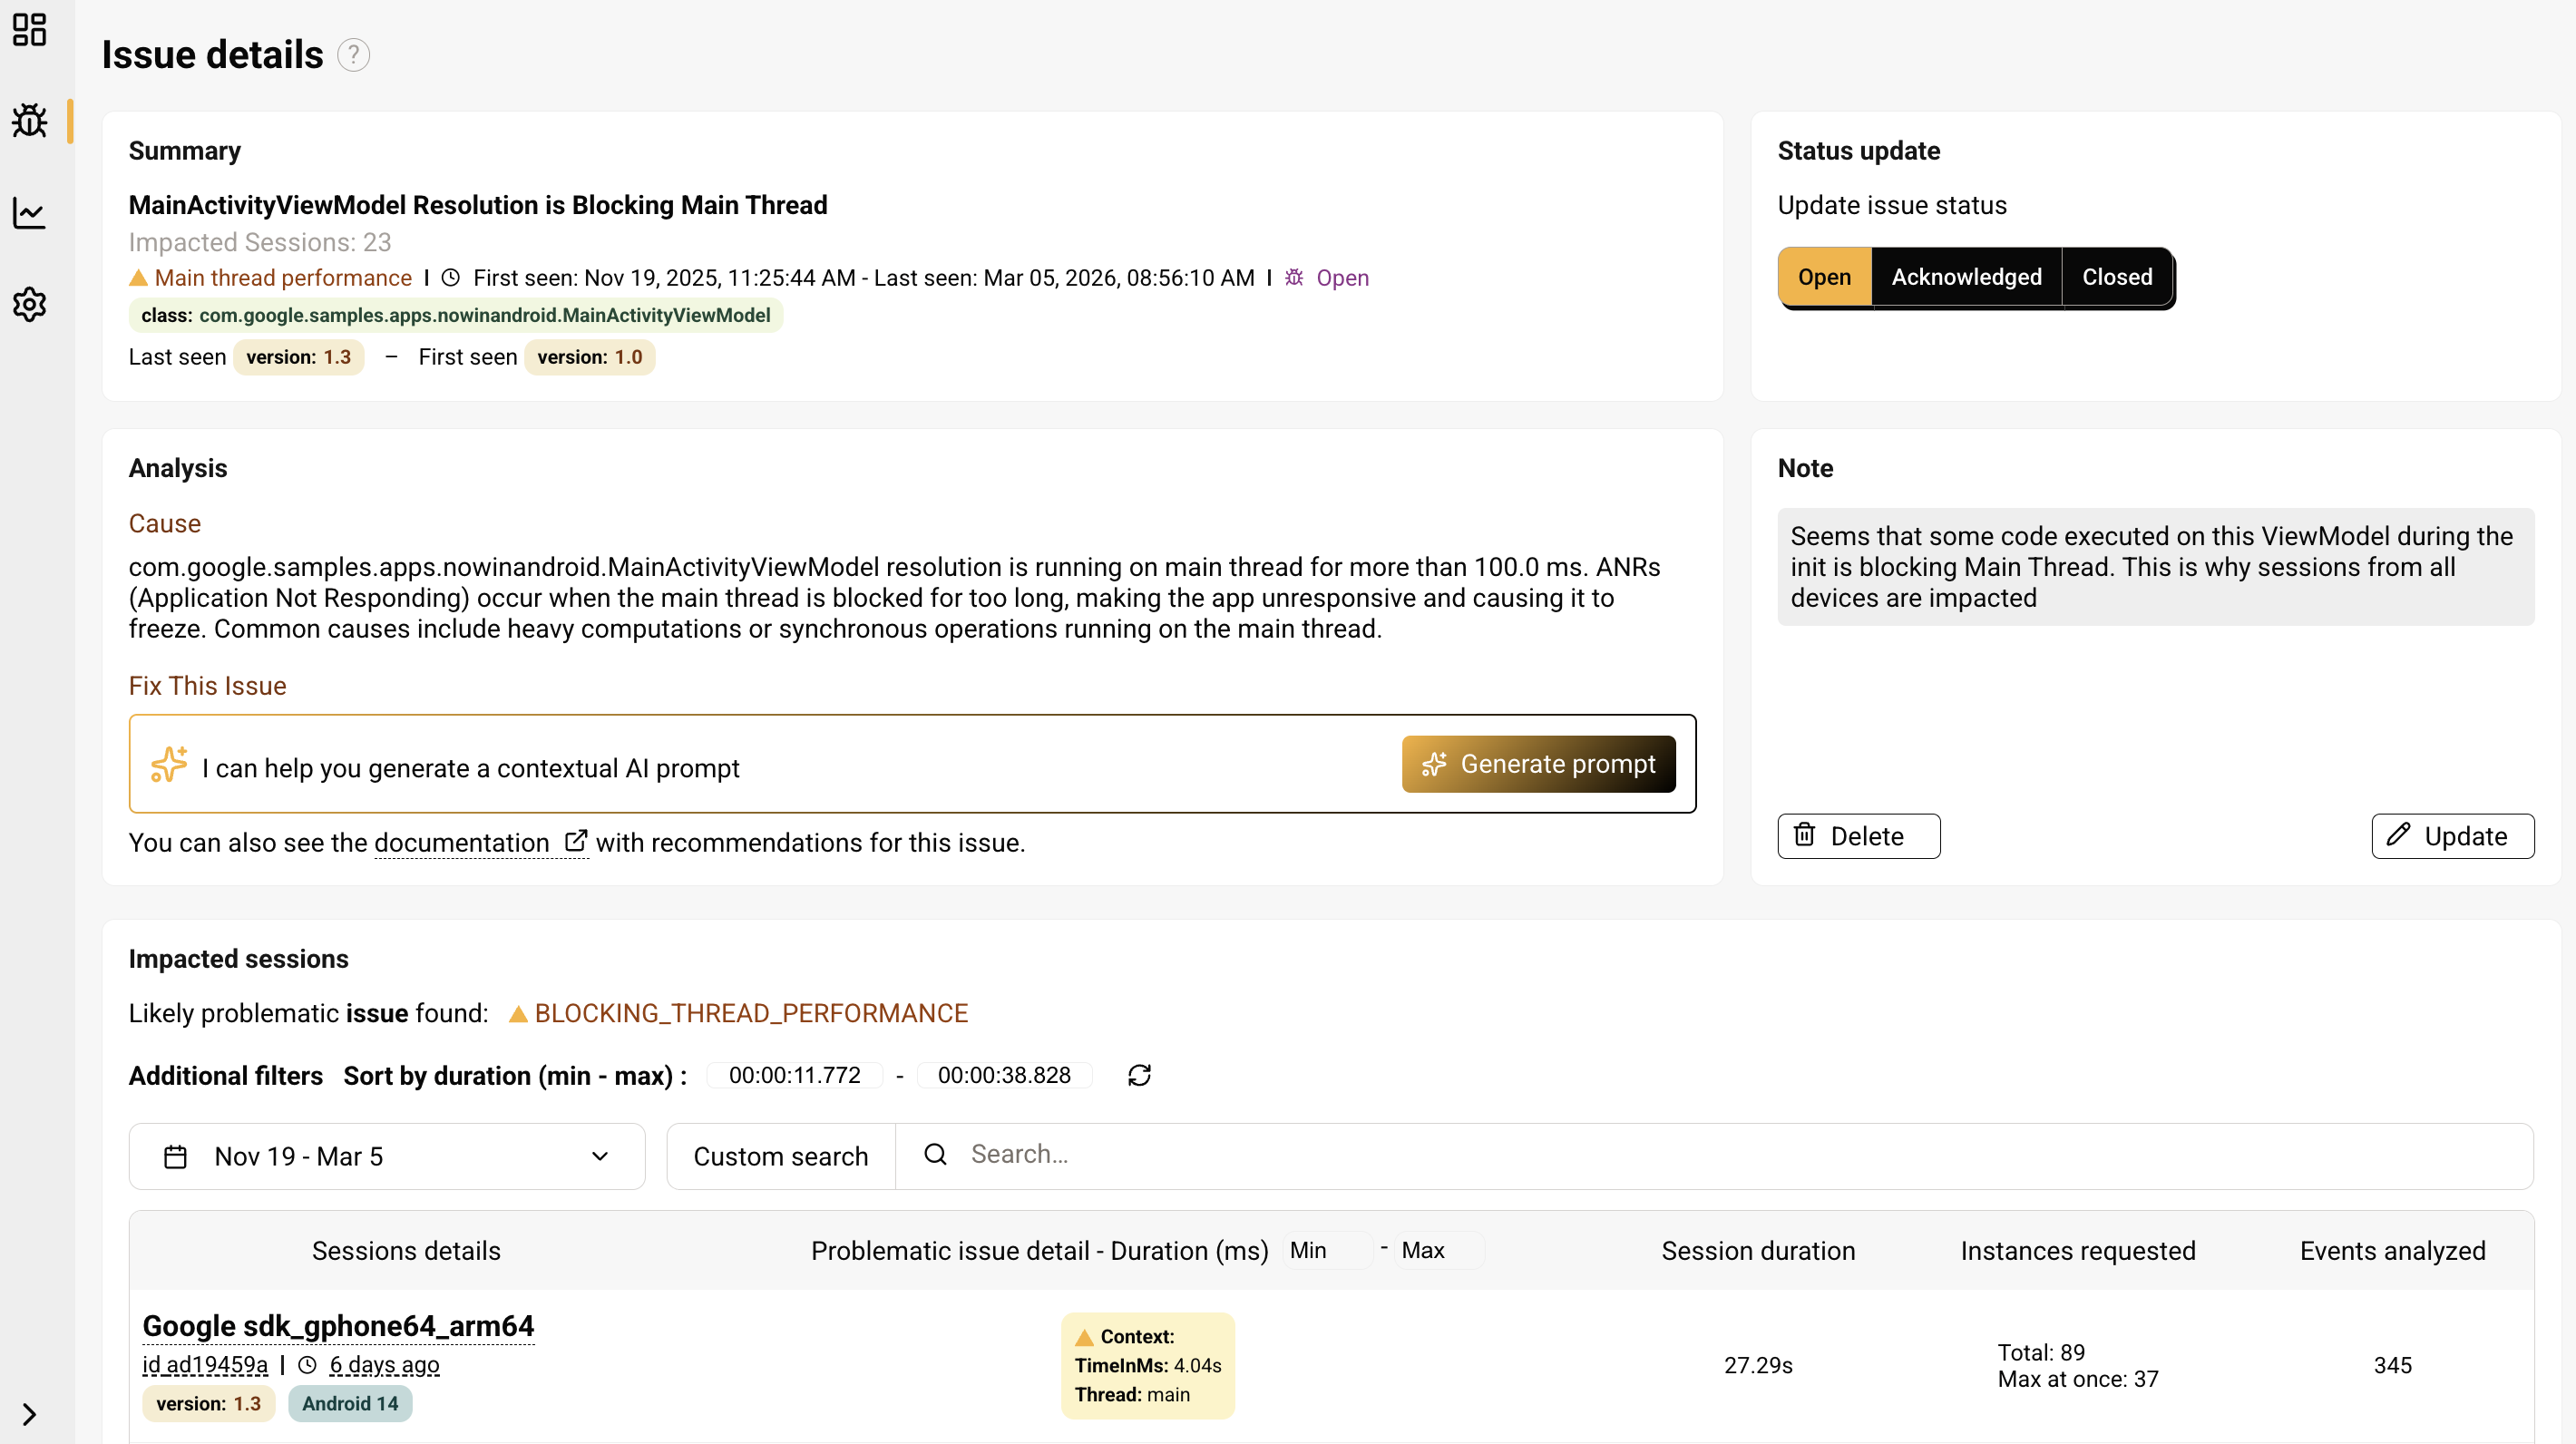
- Main thread performance issues - Components or dependencies running on the main thread for over 100ms, potentially leading to freezes or ANRs.
- Background performance issues - Slow or resource-heavy background component or dependency resolutions impacting app responsiveness.
- Dependency performance issues - Inefficient resolution of dependencies slowing down app responsiveness.
- Child dependency performance issues - Dependencies taking over 5ms to resolve, causing cascading performance slowdowns.
- Dependency complexity issues - Complex dependency graphs with more than five child dependencies, increasing maintenance and performance risks.
- Crashes - Unhandled exceptions and hard crashes that terminate the app unexpectedly.
AI-powered contextual prompts
For each detected issue, the Console generates AI-powered contextual prompts directly from all main views (Dashboard, Issues, Issue Details, Screen Details, and Timeline). These prompts give your AI coding assistant the exact context needed to accelerate root cause analysis and implement fixes.
Prompts include:
- Issue type (crash, ANR, or other performance issue)
- Impacted components, screens, and sessions
- Dependency resolution chain and statistics
- Performance insights and recommendations
- Additional context, such as factory type, bindings, and related components
Prompts can be copied directly to AI coding assistants like GitHub Copilot, Gemini, Claude Code, or Junie for rapid, accurate fixes.
Dashboard View
The Dashboard is the first view you see when accessing the Kotzilla Console for a specific app. It provides a high-level operational view of app performance, stability, and startup behavior, with drill-down entry points for deeper analysis.
All Dashboard widgets respond to global filters: time range, app version, and search parameters. Summary counters at the top show total sessions, issues, and devices for the active filters.
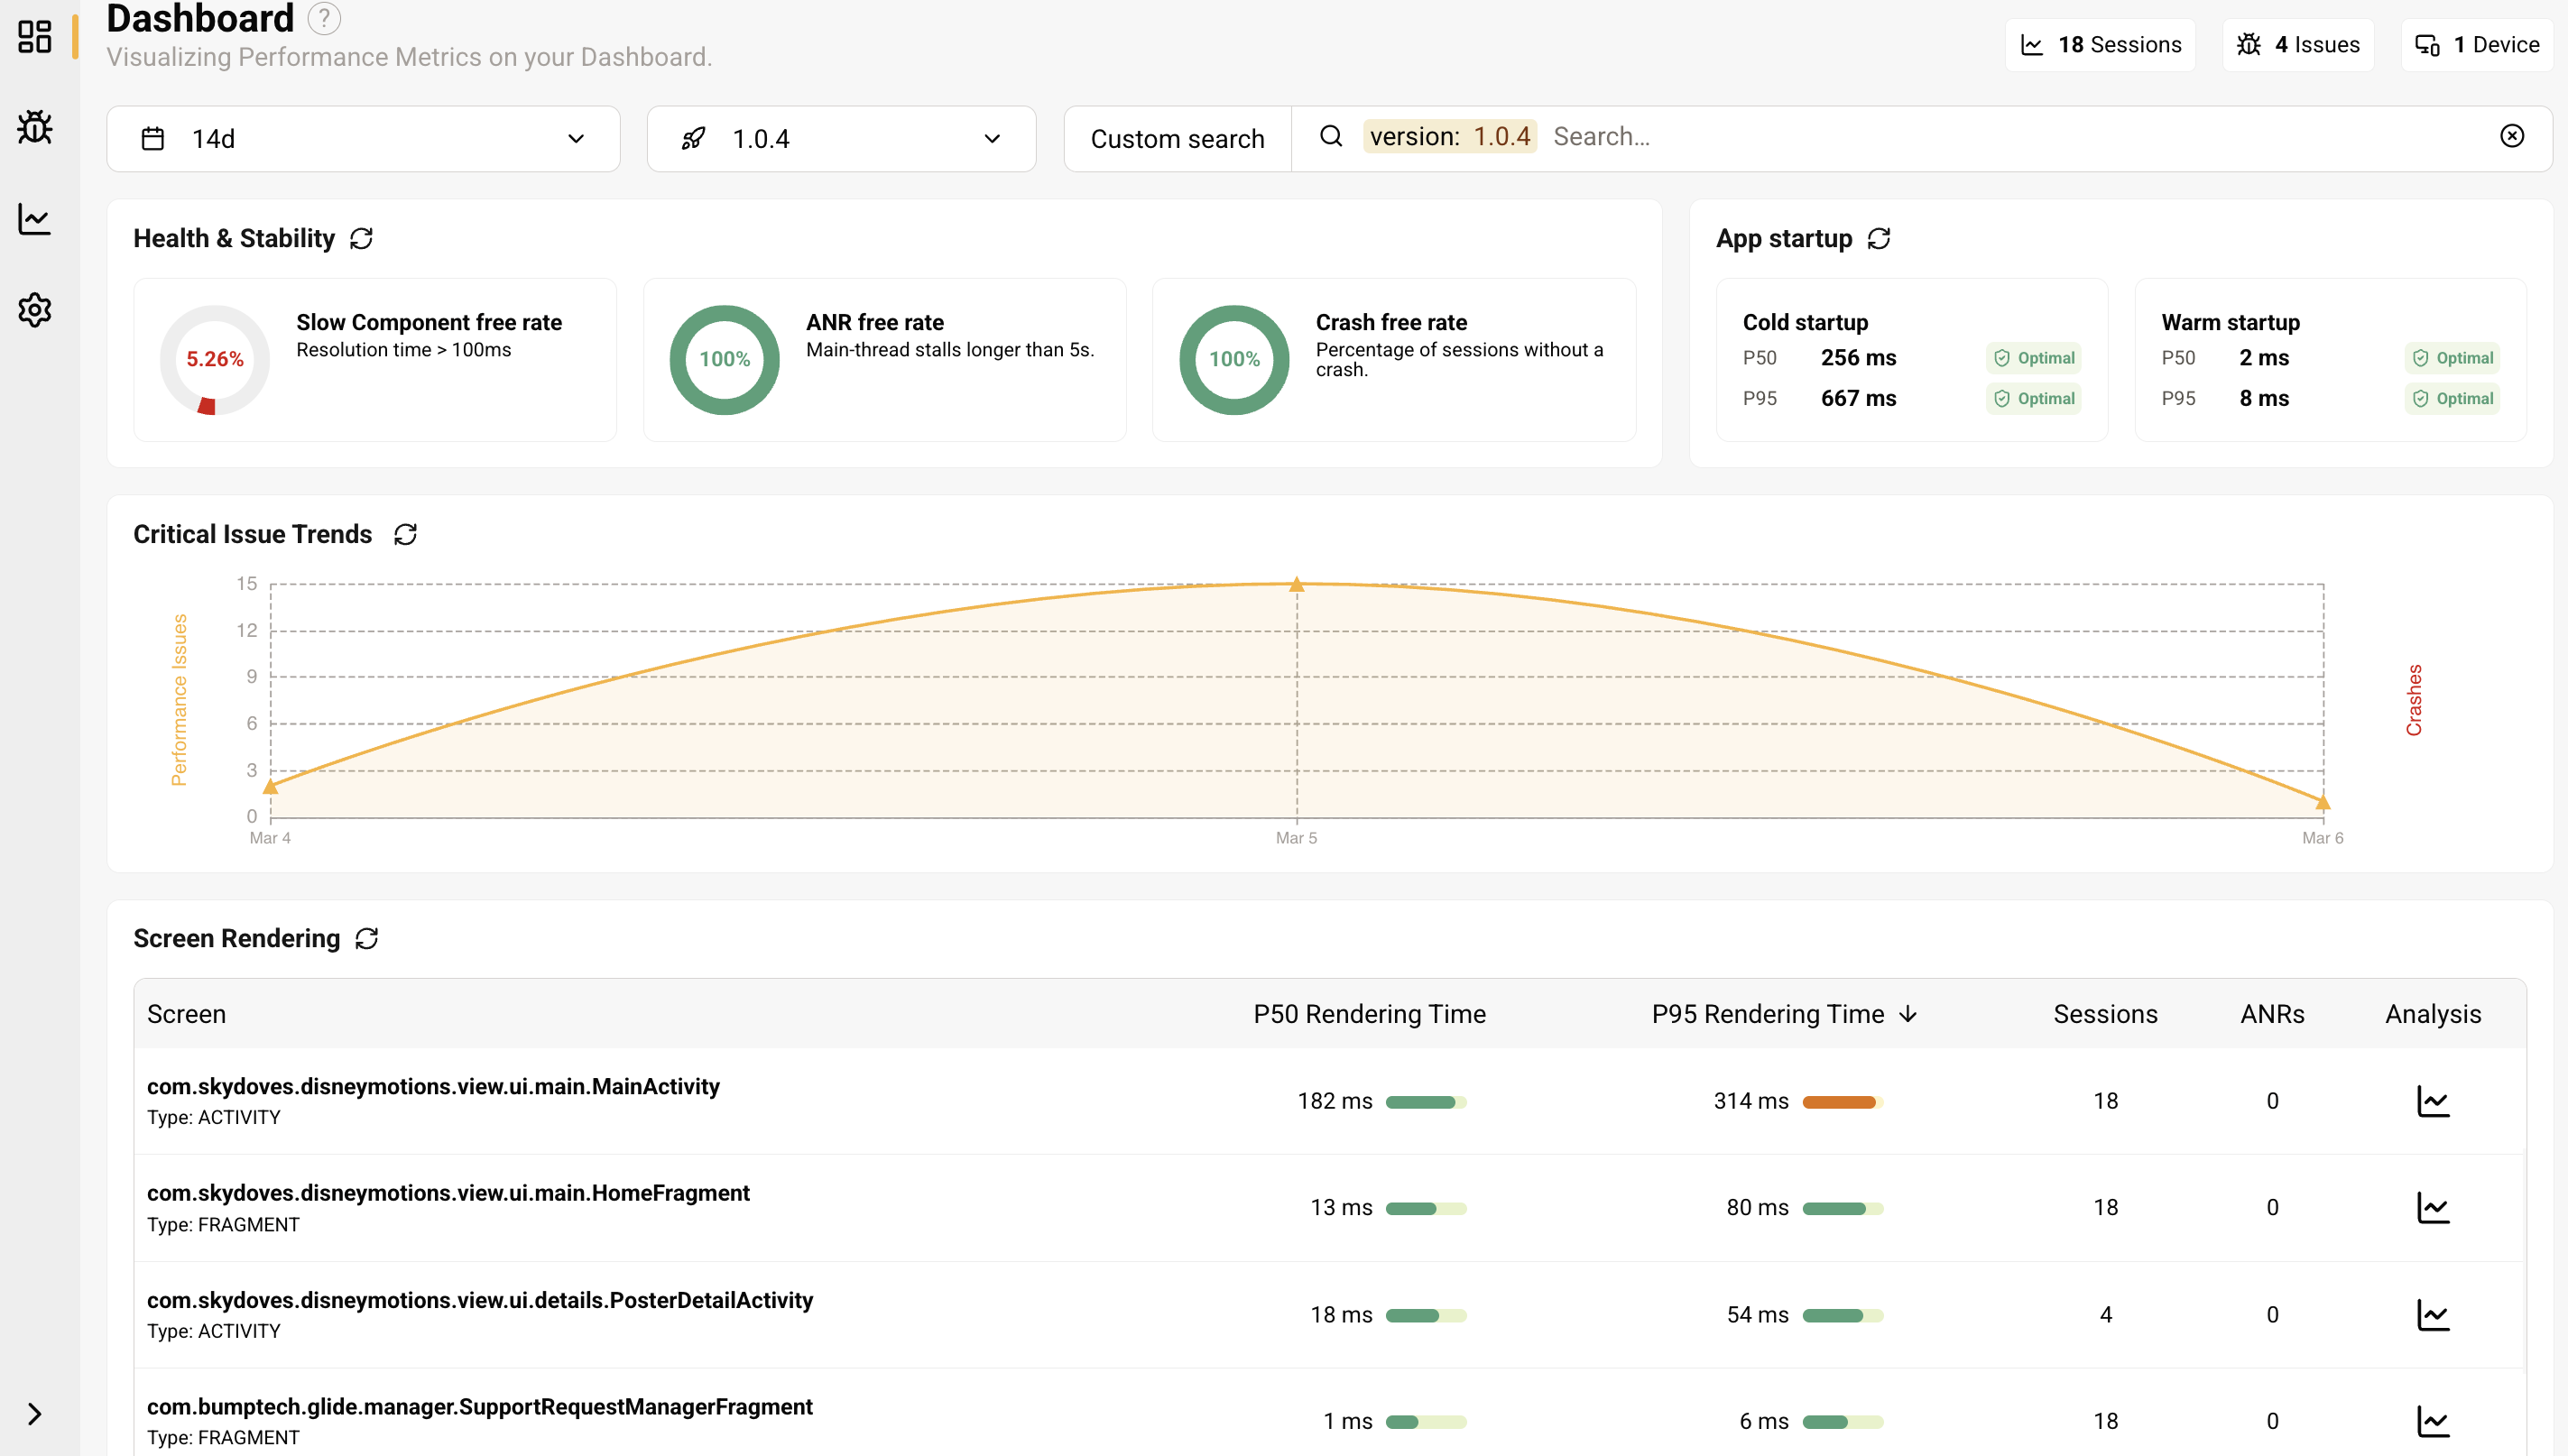
Health and stability
Three rate-based KPIs give you a quick read on app health, each with color-coded status indicators (optimal, warning, critical):
- Slow Component Free Rate - Percentage of user sessions without any slow component resolution (i.e., no component taking more than 100ms to resolve). Clicking this metric navigates to the Issues View filtered by critical performance issues (main thread and background thread).
- ANR Free Rate - Percentage of sessions without main-thread stalls above the ANR threshold. The threshold is 2 seconds.
- Crash Free Rate - Percentage of sessions without crashes. Clicking this metric navigates to the Issues View filtered by crash issues.
The status bands are aligned with Google Play targets:
| Metric | Green | Orange | Red |
|---|---|---|---|
| Crash Free Rate | >= 99.50% | 99.00% - 99.49% | < 99.00% |
| ANR Free Rate | >= 99.53% | 99.00% - 99.52% | < 99.00% |
| Slow Component Free Rate | >= 90.00% | 75.00% - 89.99% | < 75.00% |
App startup
Displays cold and warm startup performance with P50 and P95 duration metrics:
- Cold Startup - Measures time from process creation to the first usable screen, with P50 and P95 percentiles and severity indicators.
- Warm Startup - Same percentile breakdown for warm starts, where the app process already exists in memory.
Severity indicators highlight tail latency (P95) as the primary risk signal, making it easy to detect startup regressions. Clicking either metric navigates to the Issues View filtered by the corresponding startup issue type.
Critical issue trends
A time-series chart tracks the evolution of performance issues and crashes across the selected timeframe. The dual-axis visualization highlights spikes, regressions, or recovery patterns. Each data point is clickable, taking you to the Issues View for that specific day.
Slow screens
A table listing screens with their rendering performance metrics:
| Column | Description |
|---|---|
| Screen | Screen identifier (Activity or Fragment) |
| P50 | Median rendering time |
| P95 | 95th percentile rendering time |
| Sessions | Number of sessions where this screen was rendered |
| ANRs | ANR count for this screen |
| Analysis | Opens the Screen Details page for deeper investigation |
The table is sorted by worst percentile latency by default, with sorting available on P50, Sessions, and ANRs columns. Visual indicators emphasize tail performance to guide triage priority.
Screen Details
The Screen Details page provides a clear, actionable breakdown of why a specific screen is slow, helping you focus optimization efforts efficiently. You access it by clicking the Analysis action on any screen in the Slow Screens table.
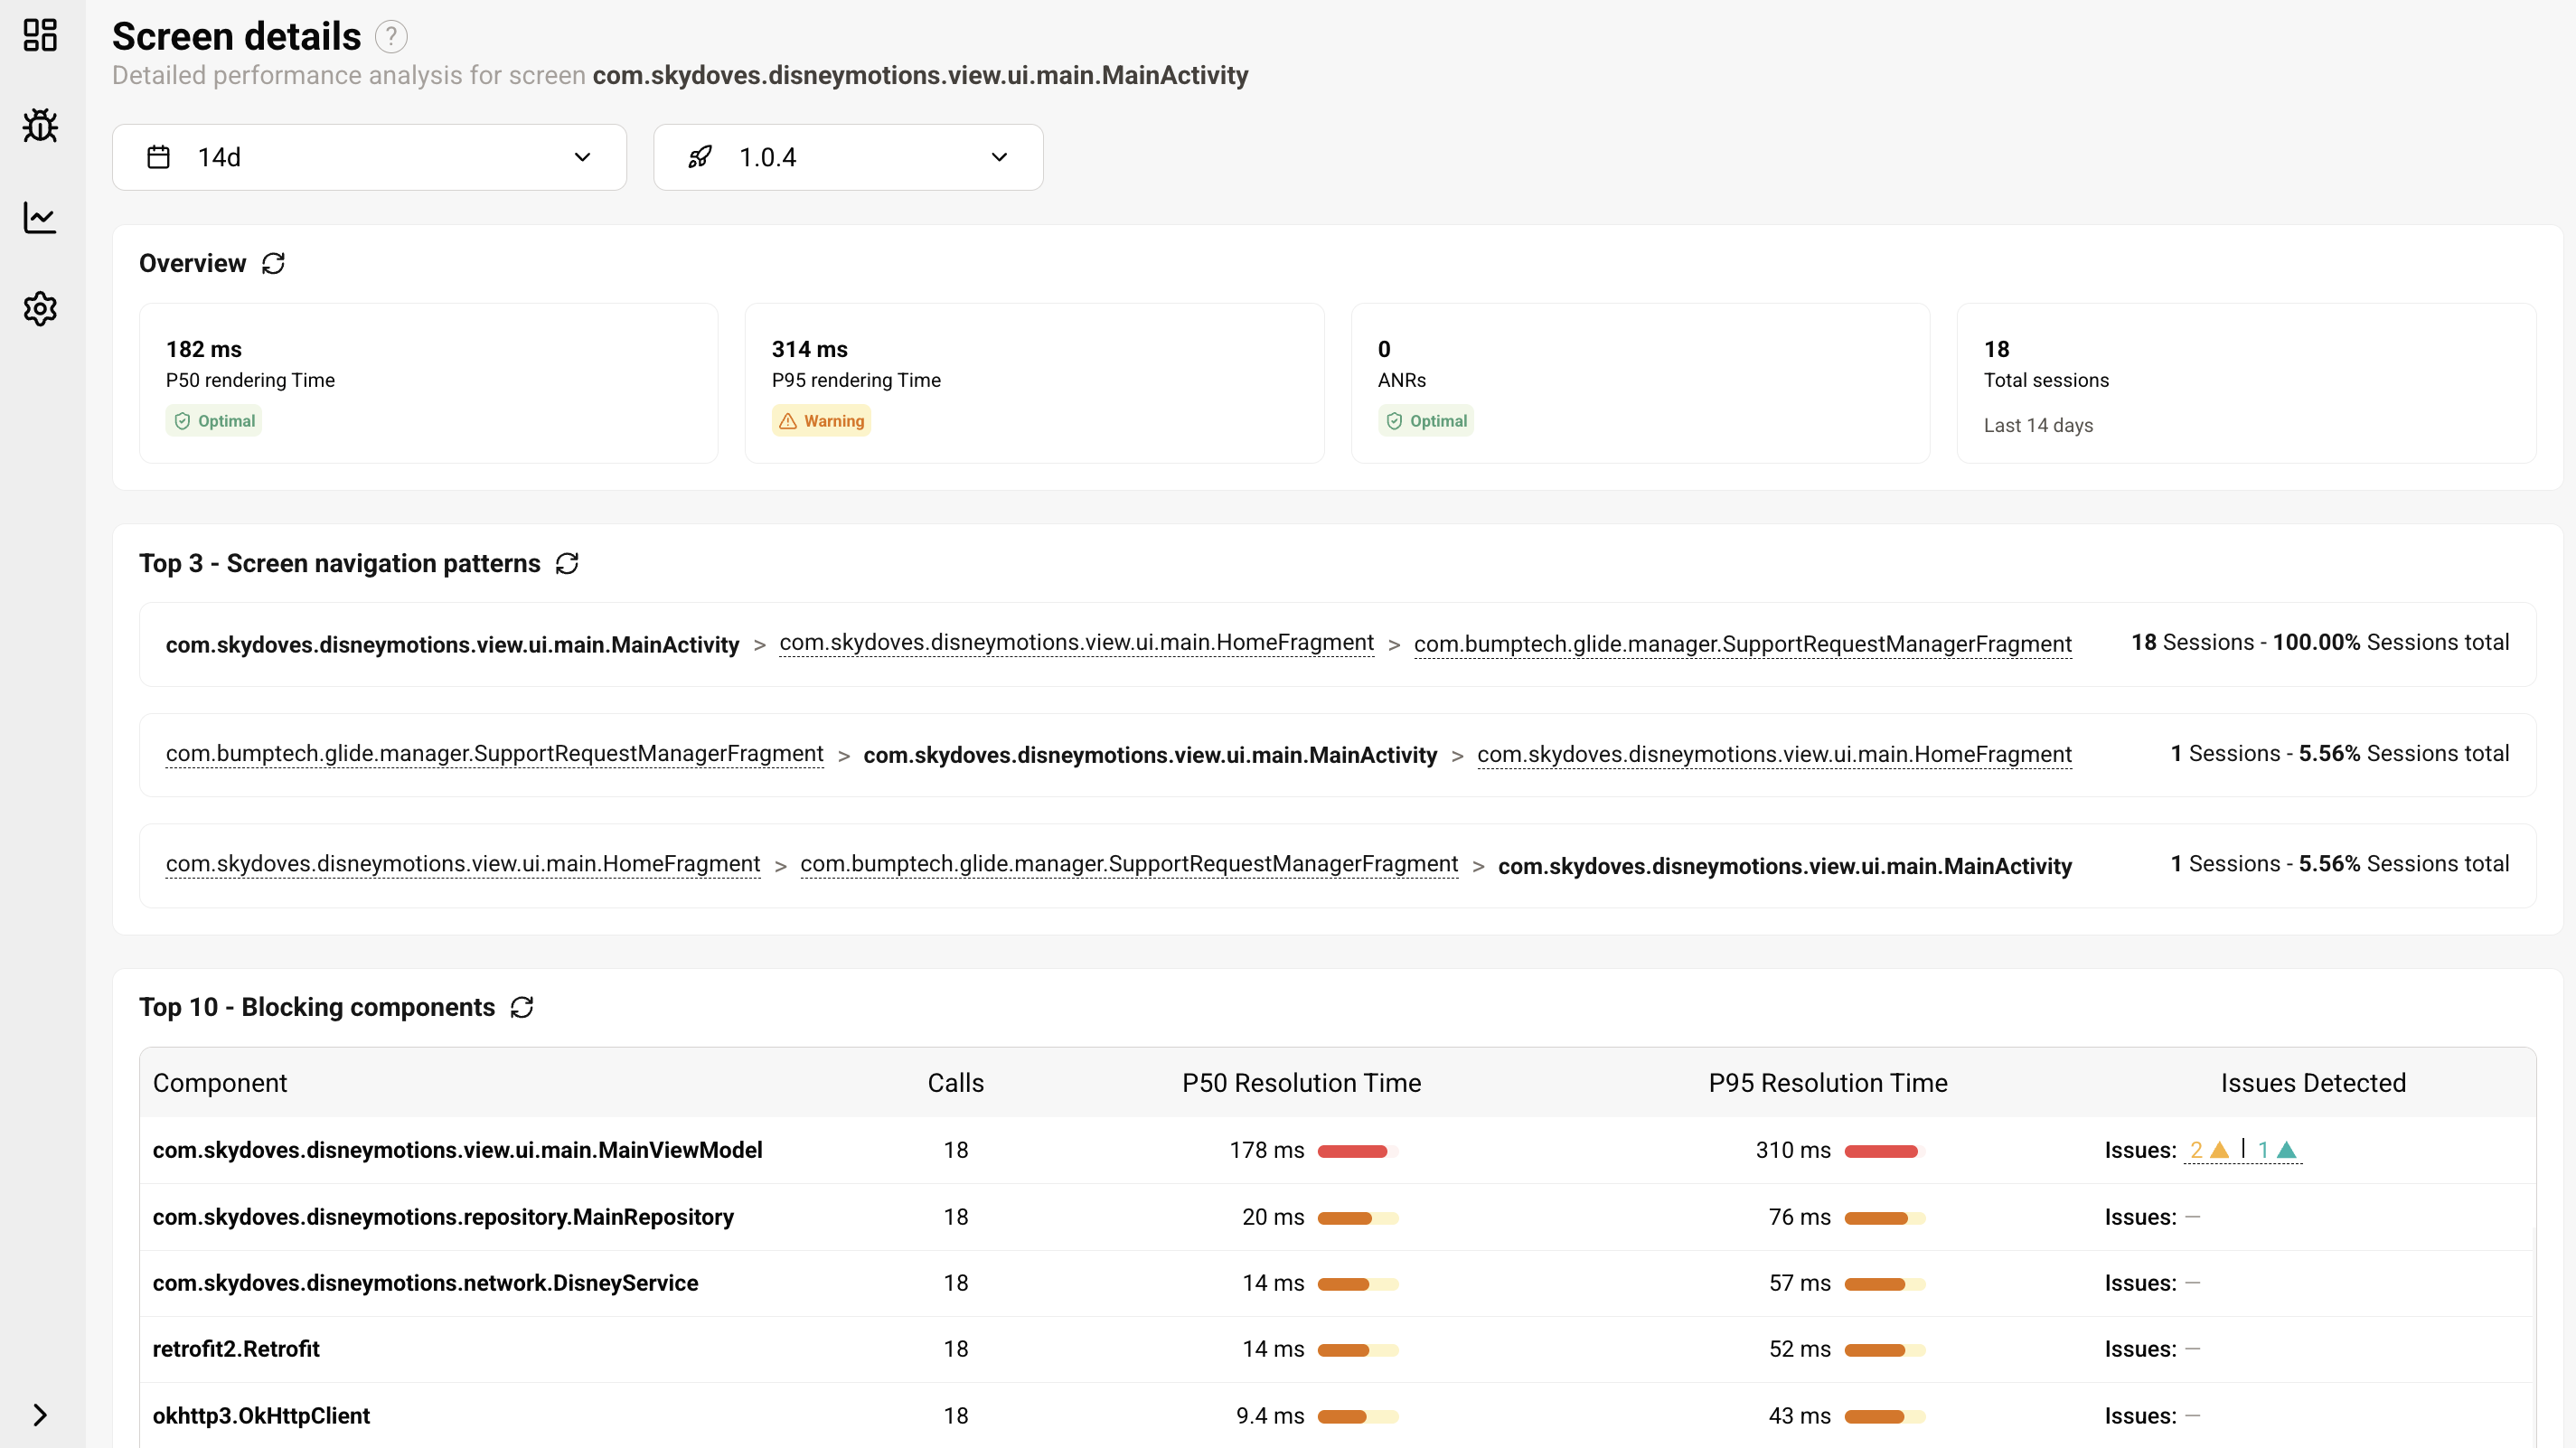
Overview
At-a-glance KPIs for the selected screen:
- P50 and P95 rendering time
- Total sessions affected
- ANRs and critical issues
- Status indicators (optimal, warning, critical)
Breadcrumb navigation, time range, and version filters are available at the top of the page.
Top navigation patterns
Shows the top 3 navigation patterns that include this screen, regardless of position (start, middle, or end of the sequence). Patterns cover Activities and Fragments as well as Compose Navigation screens (Navigation 2 and Navigation 3), so Compose-based and multiplatform apps get the same screen-level visibility. Each pattern displays a three-screen flow with the percentage of sessions it represents.
For example, for MainActivity:
- MainActivity -> HomeFragment -> SupportRequestManagerFragment (18 sessions, 100%)
- SupportRequestManagerFragment -> MainActivity -> HomeFragment (1 session, 5.56%)
- HomeFragment -> SupportRequestManagerFragment -> MainActivity (1 session, 5.56%)
This helps you understand the user flows where the slow screen has the most impact.
Top blocking UI components
A ranked list of components contributing to screen slowness:
| Column | Description |
|---|---|
| Component Name | The Koin component resolved during screen rendering |
| Calls | Number of times this component was resolved |
| P50 | Median resolution time |
| P95 | 95th percentile resolution time |
| Issues | Detected issues with direct links to Issue Details |
Default sorting is by P95 rendering time (descending), with additional sorting on P50 and Calls. This table pinpoints the main performance bottlenecks and links directly to actionable issue details.
Issues View
This page provides visibility into all detected issues across your app, including crashes, performance problems, and architectural issues identified via the Kotzilla SDK. It offers multiple views to help monitor, prioritize, and resolve problems effectively.
The page is composed of two views, allowing you to focus on critical issues or to get an overview of all issues detected. Both views include the complete list of issues, with filtering options by app version, issue type, impacted class, and full-text search across properties. For each issue, the view displays key information:
- Issue description: A concise explanation of the issue type and its impact
- Impacted user sessions: The number of sessions in which the issue was observed
- Affected app versions: Versions of the app impacted by the issue
- Issue status: Whether the issue is open, acknowledged, or closed
AI-powered contextual prompts are available in both the Critical Issues and All Issues views.
Critical Issues View
This view displays issues from the following types: Crashes, Startup performance, Main thread performance or Background thread performance.
Critical Issues highlight the problems that require immediate attention as they are directly impacting user experience. Notes may be included for additional context.
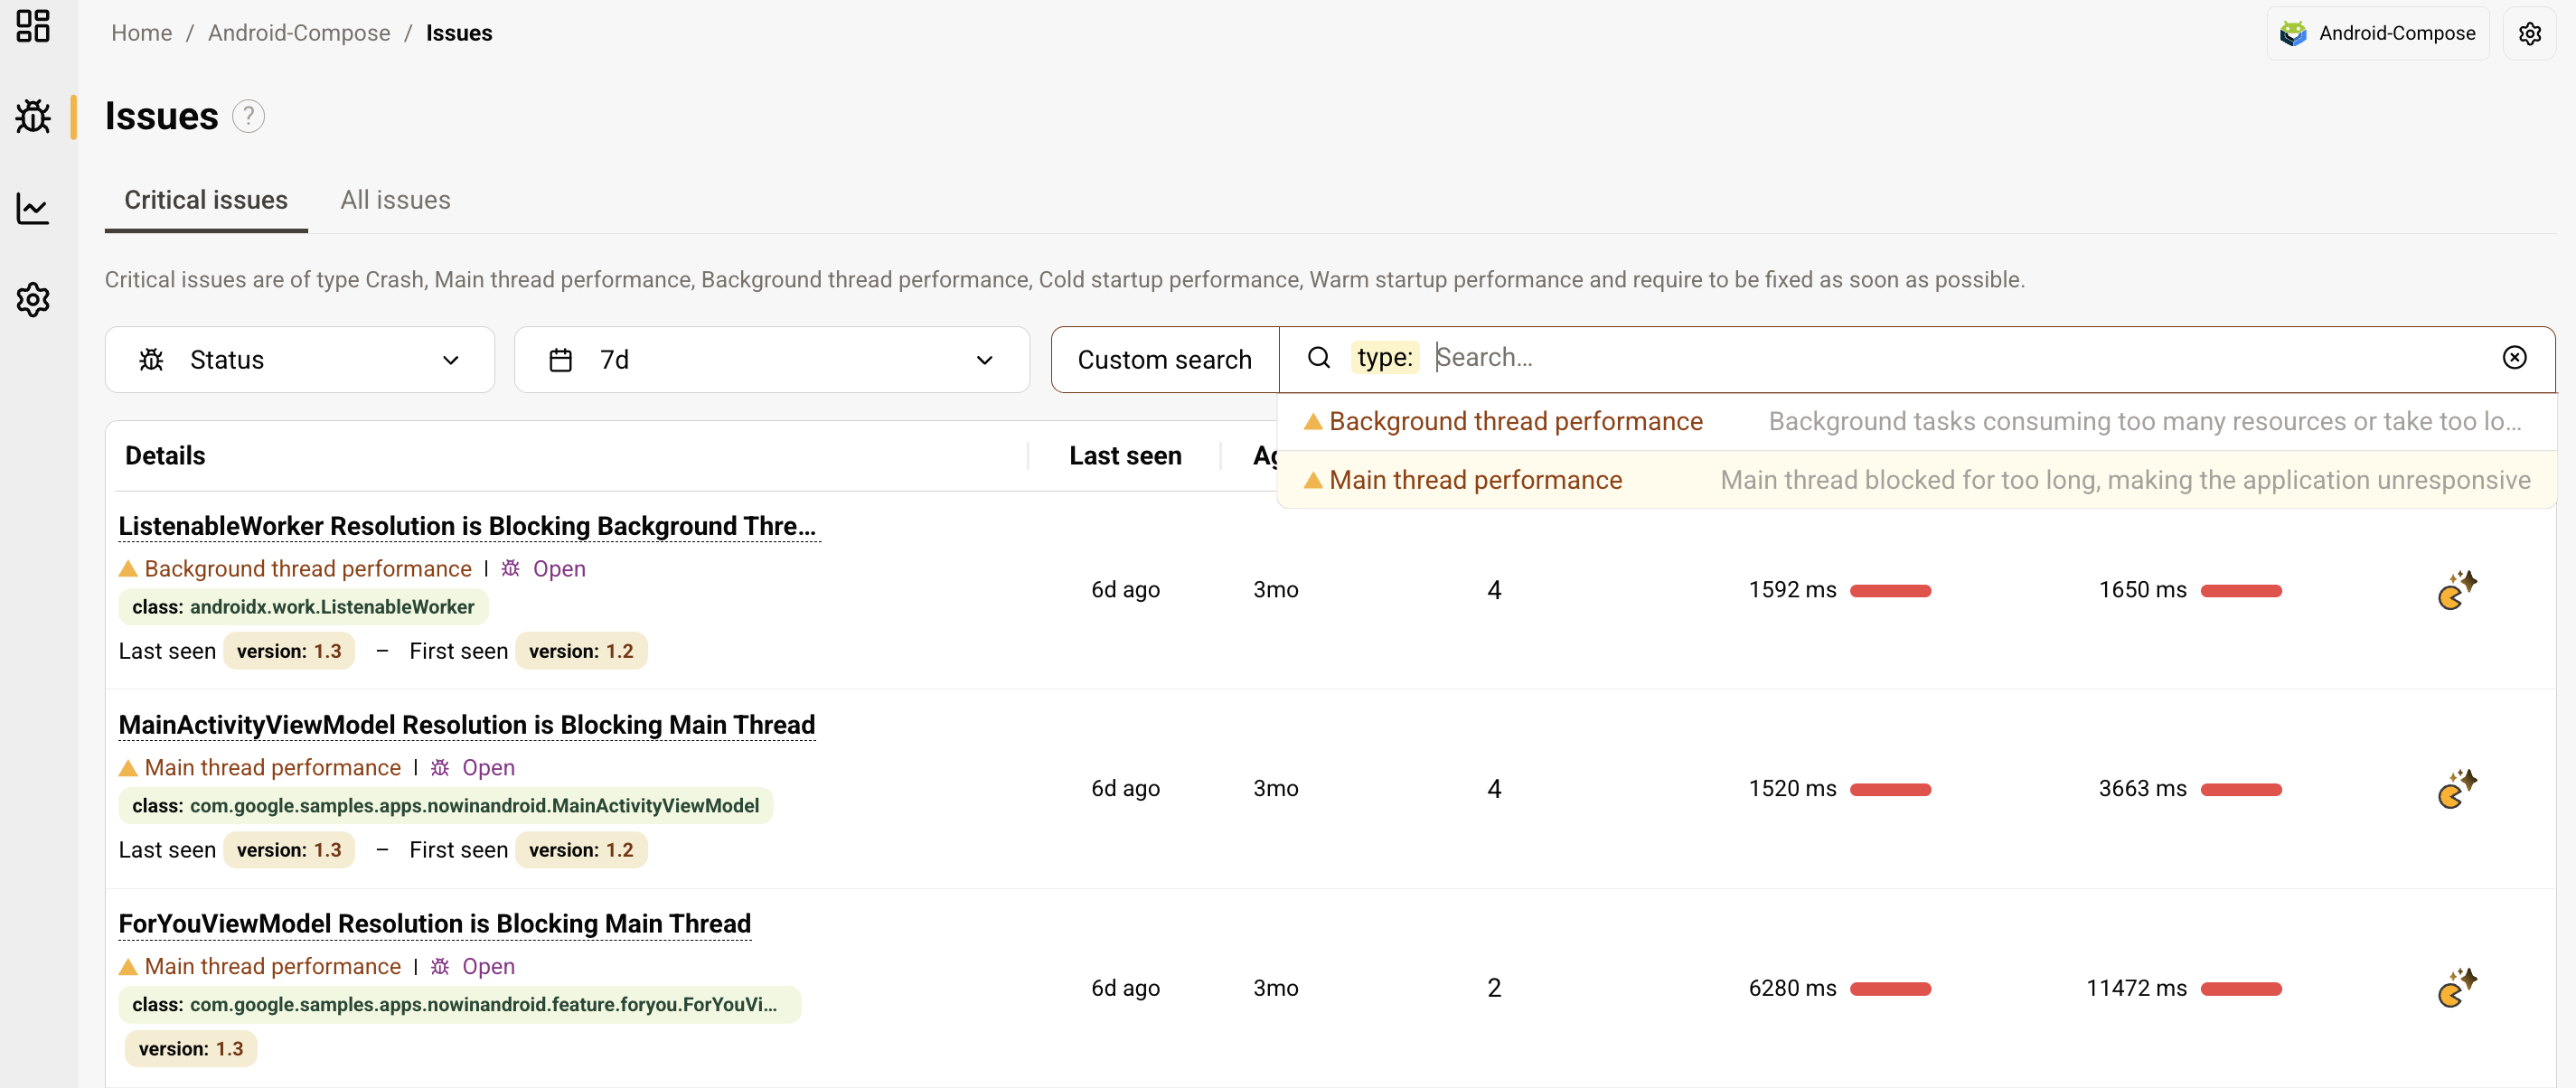
Issues are sorted by the number of impacted sessions, so the most widespread problems surface first. Each issue also displays P50 and P95 resolution times to help you assess both typical and worst-case performance impact.
All Issues View
This view includes all issues from the Critical Issues view, as well as any other performance and architectural issues detected by the platform. Notes may also be included for each issue.
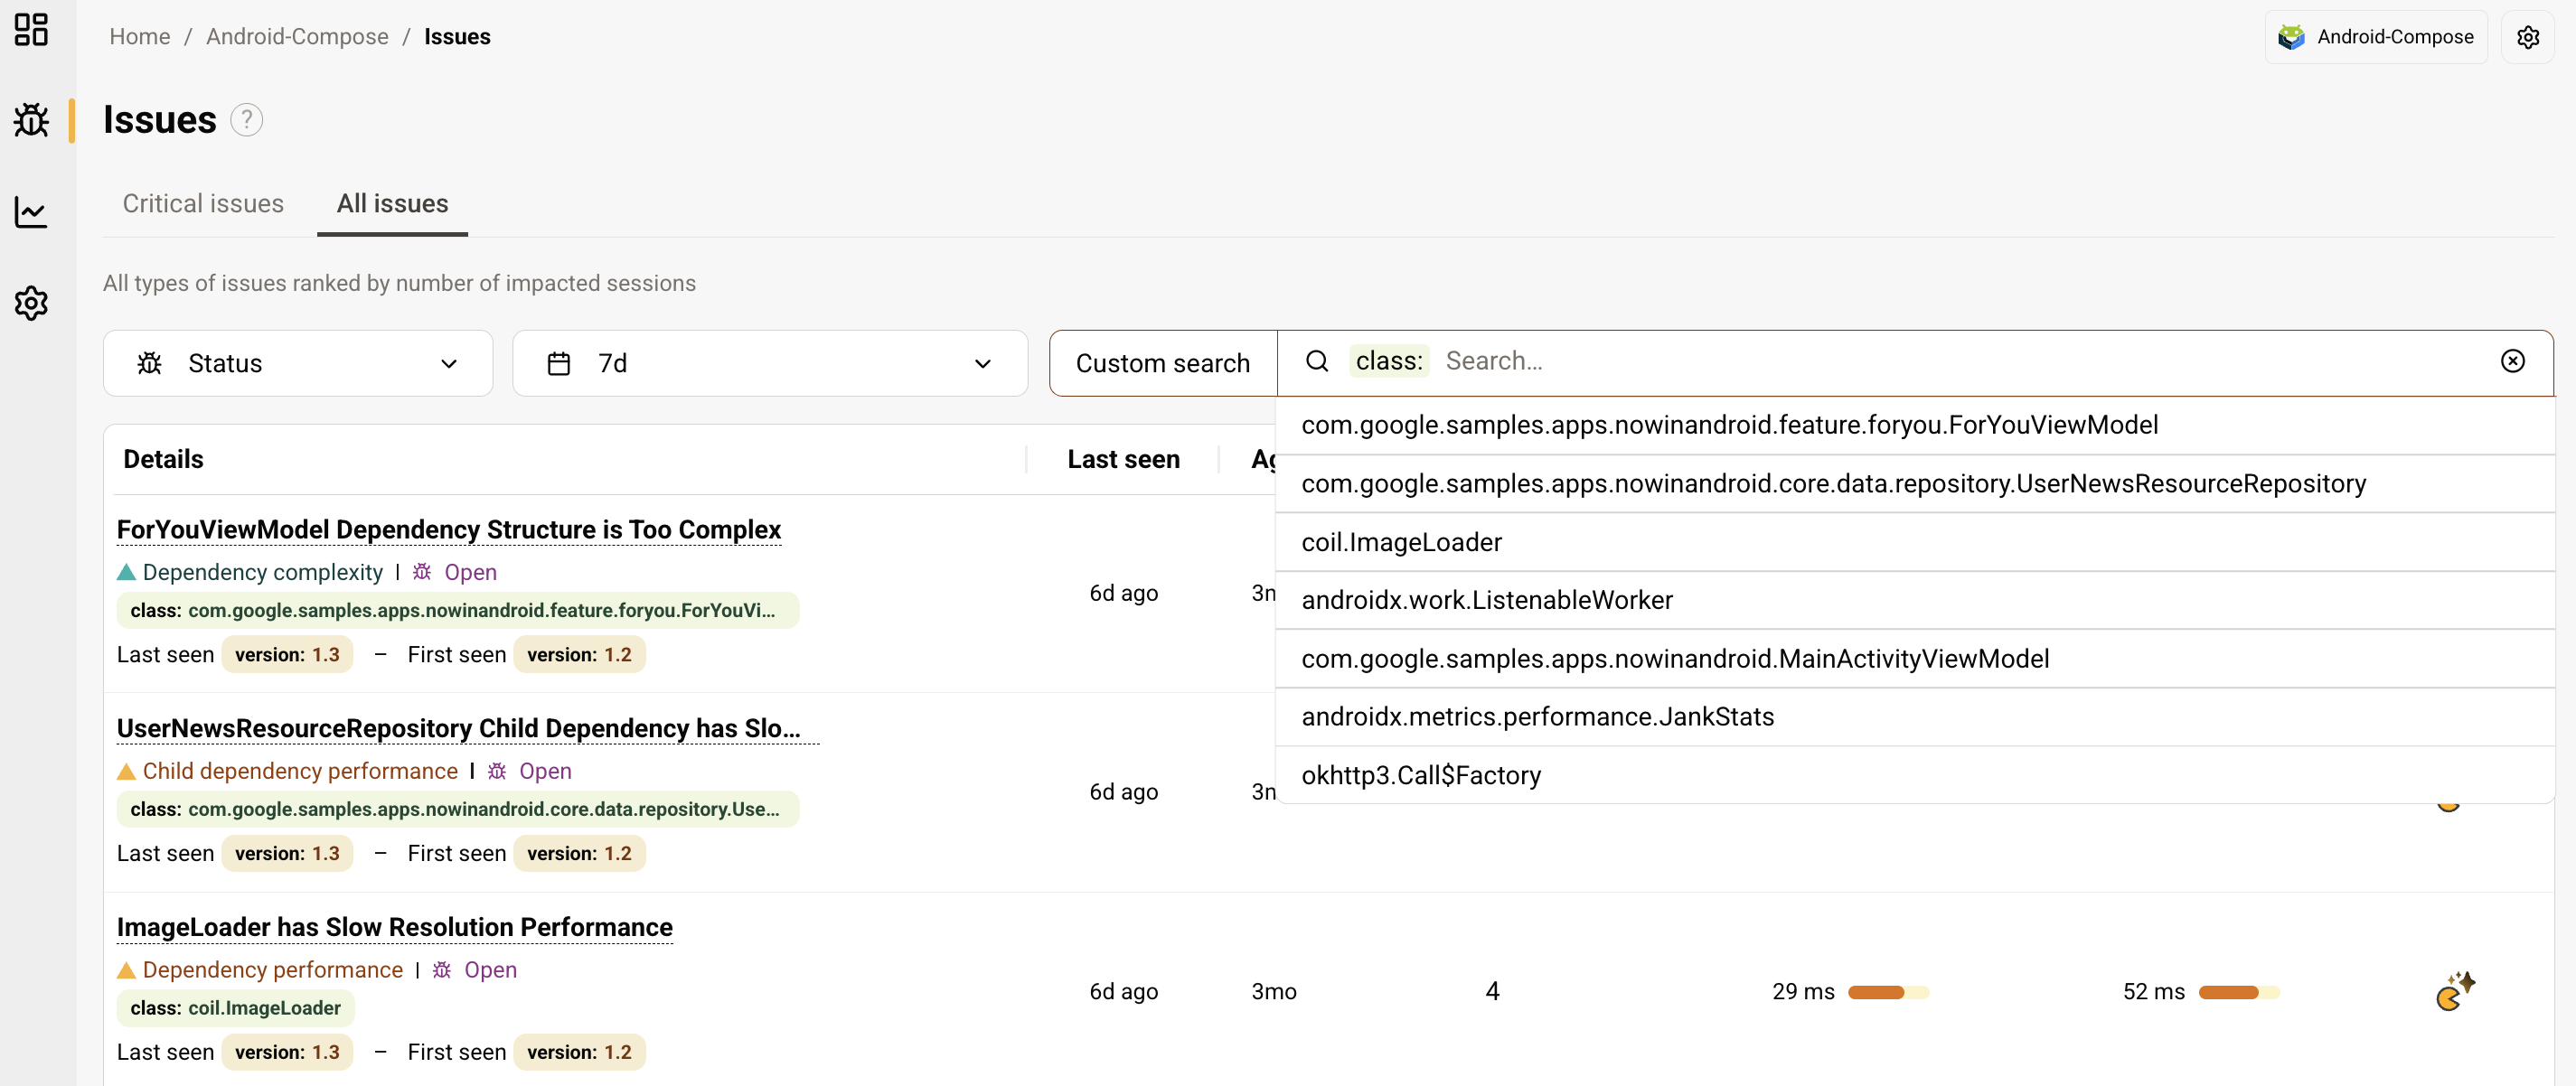
You can click on any issue to view detailed information such as stack traces for crashes, or explanations on the cause of the issue for performance, memory and app complexity problems. The issue details view shows both impacted user sessions and impacted screens, allowing you to investigate from the issue level down to specific sessions or switch to screen-level analysis to see which screens are affected
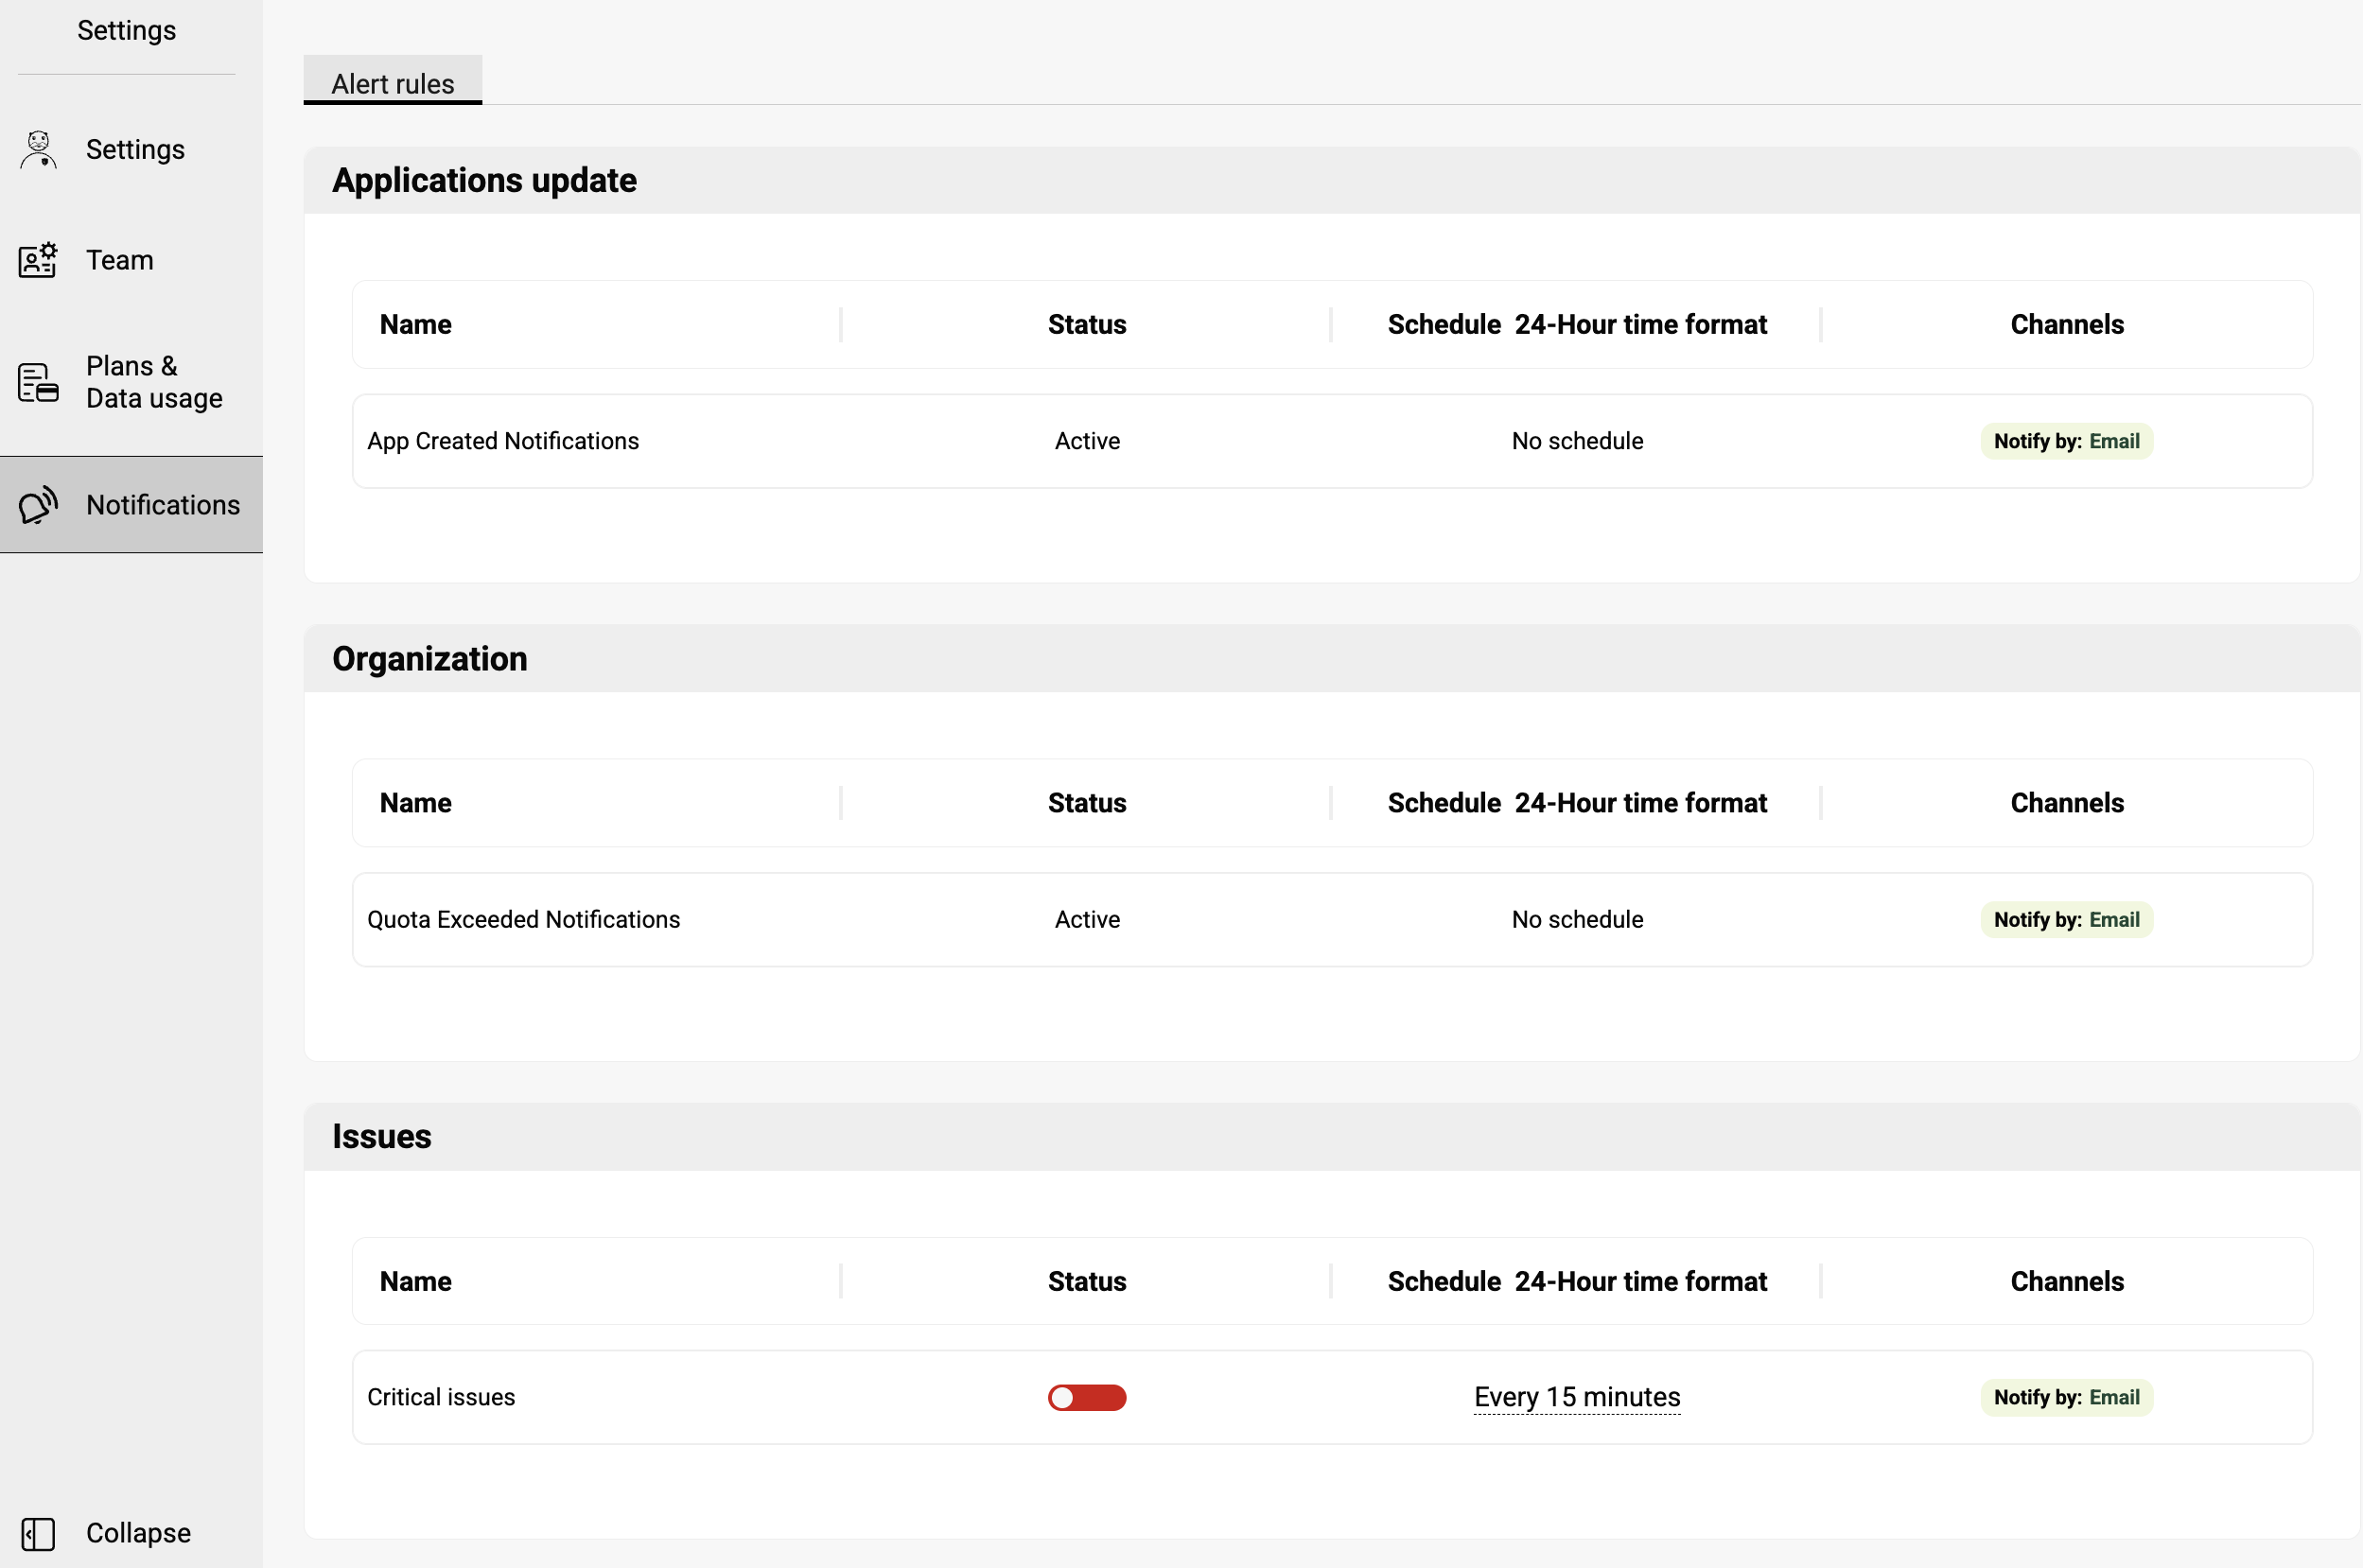
Critical Issues Notifications
The Kotzilla Console includes a Notification Center that allows users to enable email notifications for critical issues detected in their apps.
Key points:
- Notifications can be enabled or disabled globablly for all apps within your organization.
- The schedule of notifications is configurable, ranging from every 15 minutes up to once per month.
This ensures that teams are promptly informed of critical issues affecting user experience, without requiring manual monitoring.
Timeline View
The Timeline View offers a complete, interactive picture of a specific user session to help you quickly understand app behavior and investigate the root causes of issues.
You can access the Timeline View by:
- Selecting a specific user session from the Sessions View
- Jumping directly from a flagged issue in the Issues View, where the view will focus on the session and event involved
The view is organized into three main sections:
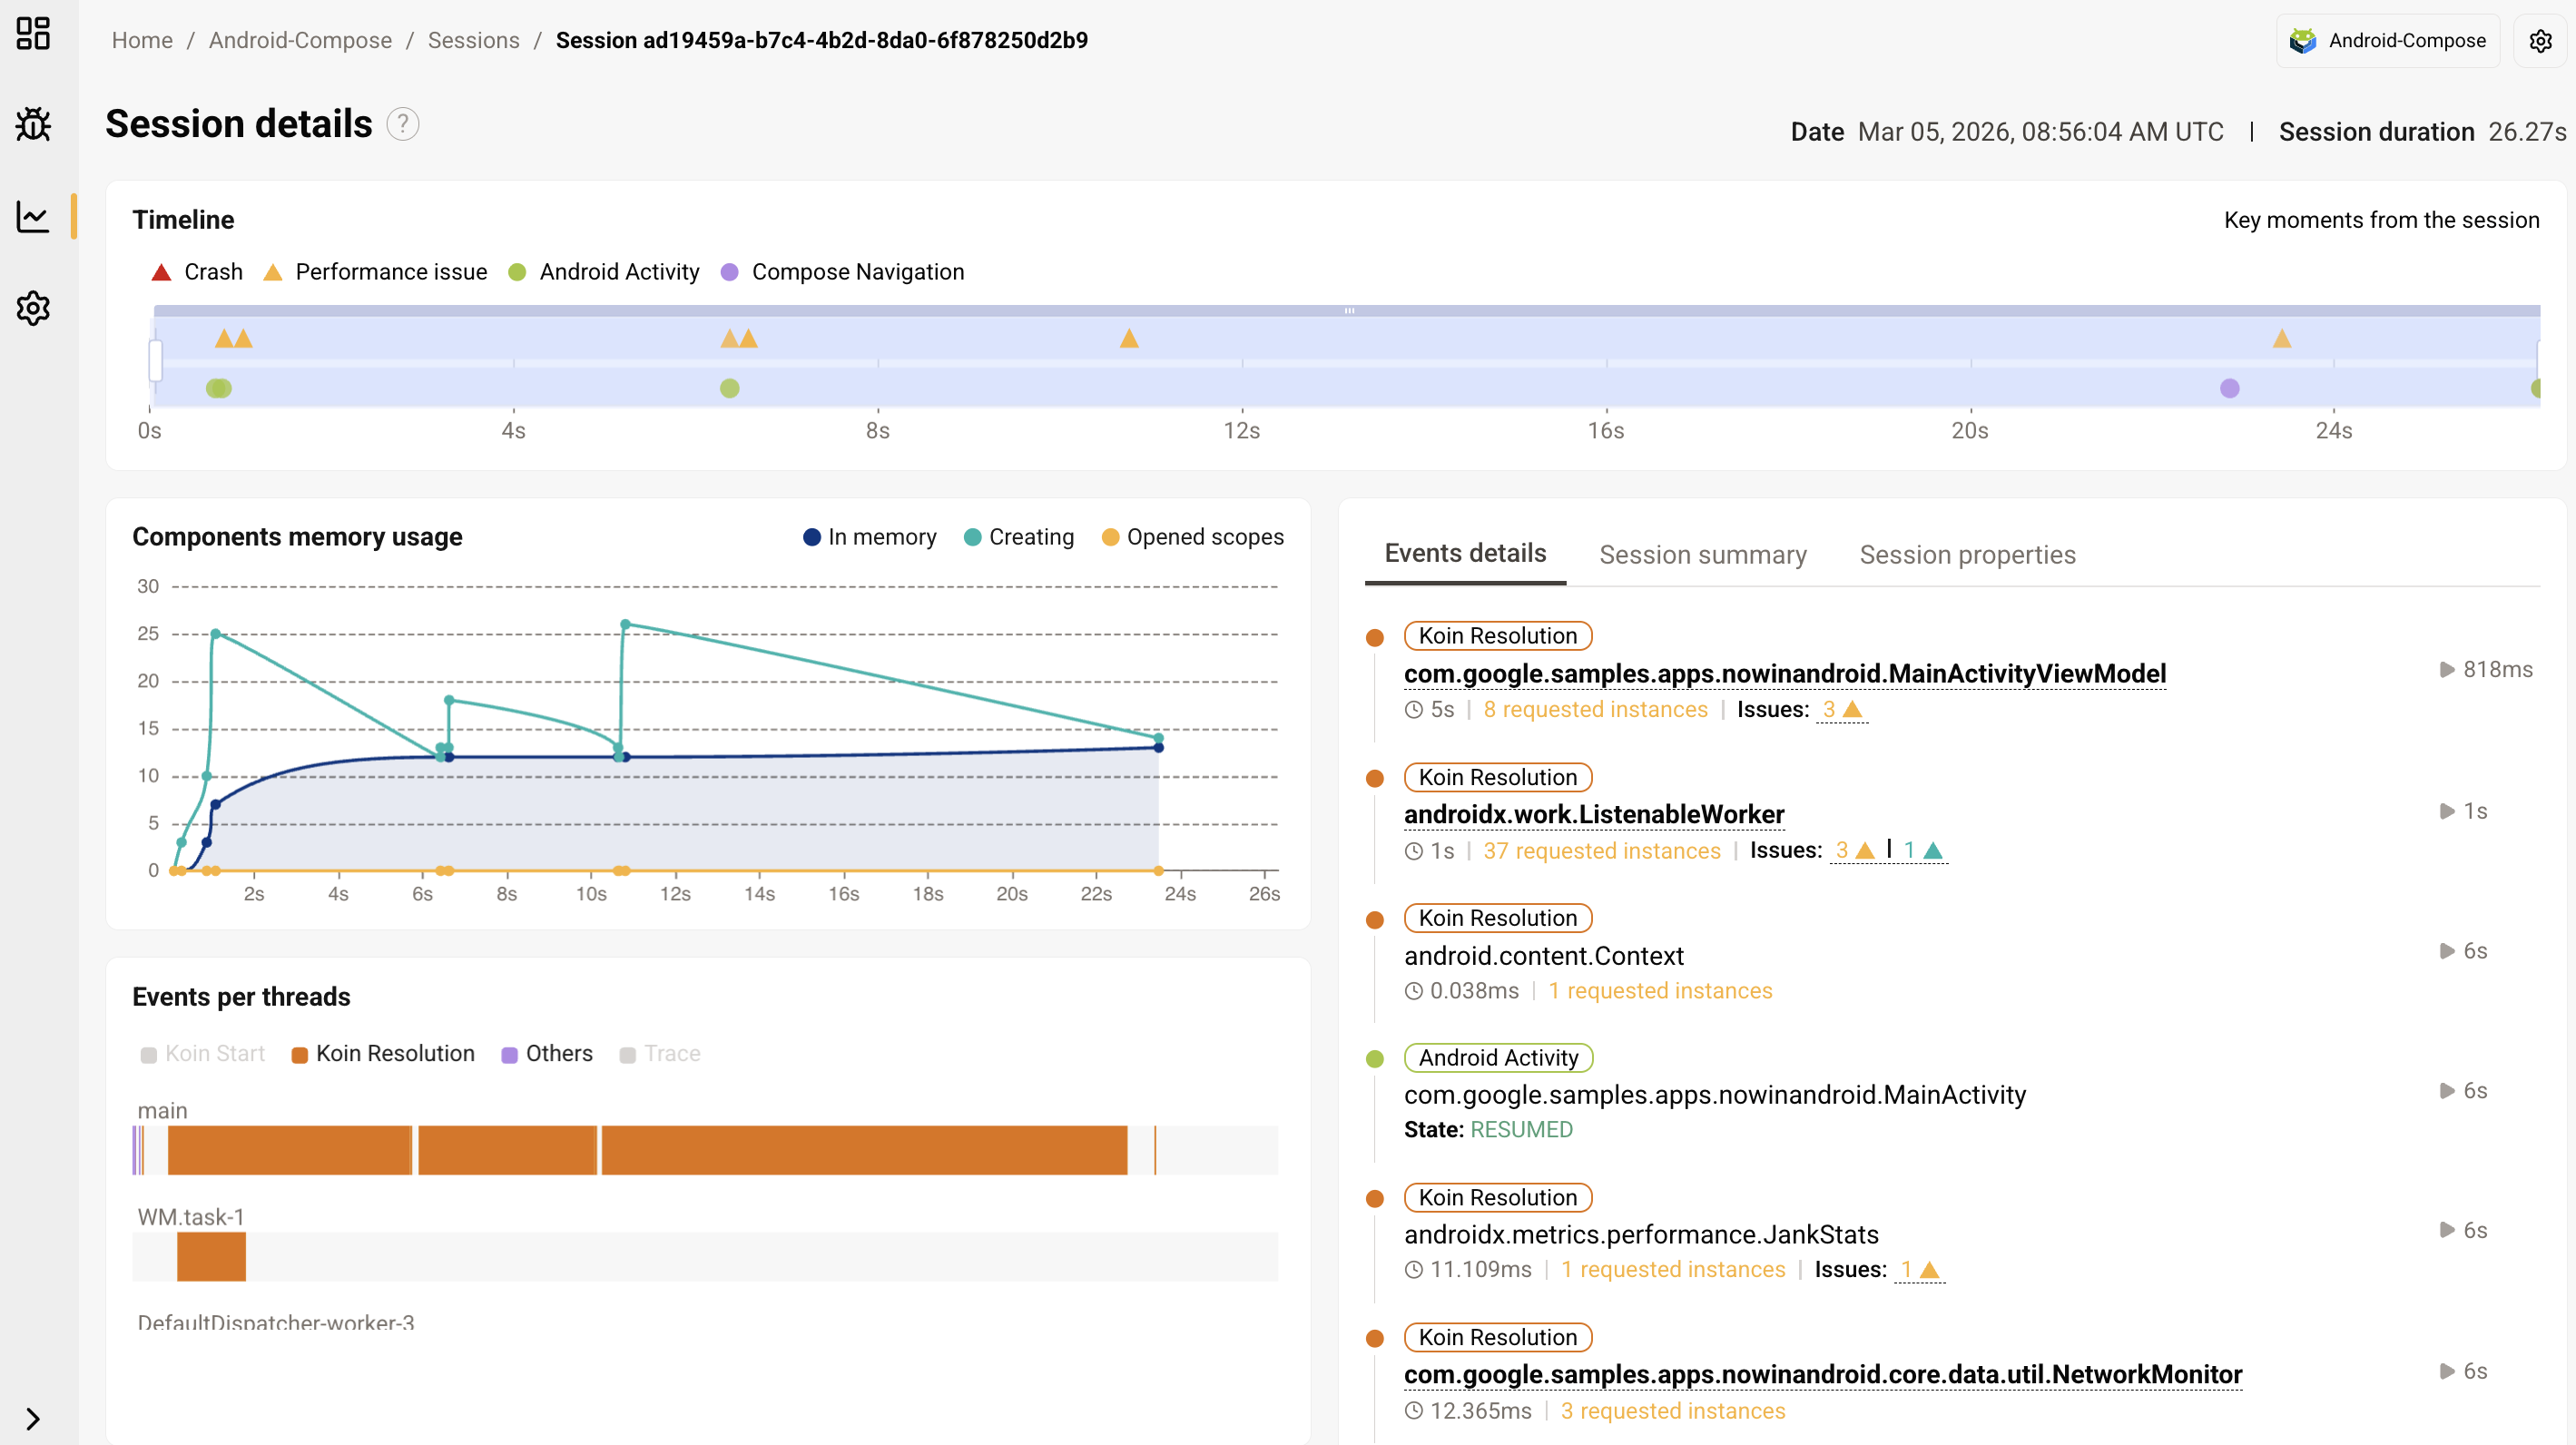
Key user session moments
At the top of the screen, this visual timeline highlights key moments across the session such as screen transitions, crashes, and issues detected by the platform. You can zoom in to narrow the focus, and the other two sections will automatically update to reflect the selected time range.
Session activity graphs (left section)
This section provides a visual breakdown of how the session behaved under the hood, helping you analyze both app workload and execution flow. It includes:
-
Memory Graph: Displays components’ memory usage during the session, including components currently in memory, components created, and any open scopes.
-
Thread Timeline: Provides a visual representation of how key events were scheduled and executed across your app’s threads.
Two other tabs give access to session-level context:
- Session summary: Displays device information, OS version, app version, and the timestamp of the session’s creation
- Session properties: Shows custom metadata you’ve attached to the session using the Kotzilla SDK API, such as user preferences, app settings, or environment flags
Detailed event insights (right section)
This section provides a deep dive into everything that occurred during the session, making it easier to trace specific issues or understand runtime behavior.
Here you’ll find:
-
The full sequence of events, including component and dependency resolutions, their types, bindings, and additional metadata
-
Issues flagged by the platform, displayed in context and directly linked to the components or dependencies involved
-
Live synchronization with other views, so filtering or zooming in any view automatically refines the data displayed here
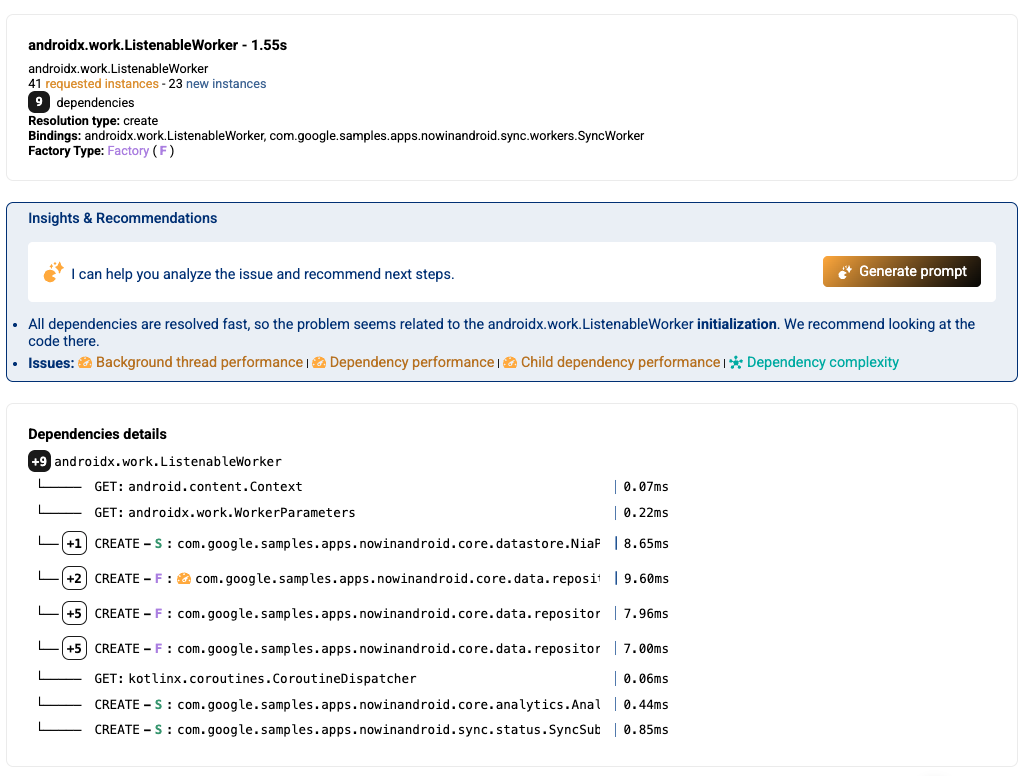
A tree graph view displays child nodes for each component resolution event, allowing you to visually explore dependency hierarchies and identify which dependency resolutions take the most time.
This view also provides analysis and actionable recommendations to pinpoint slow dependency resolutions or component initialization issues, and AI-powered contextual prompts can be generated directly from these insights to help implement fixes quickly.
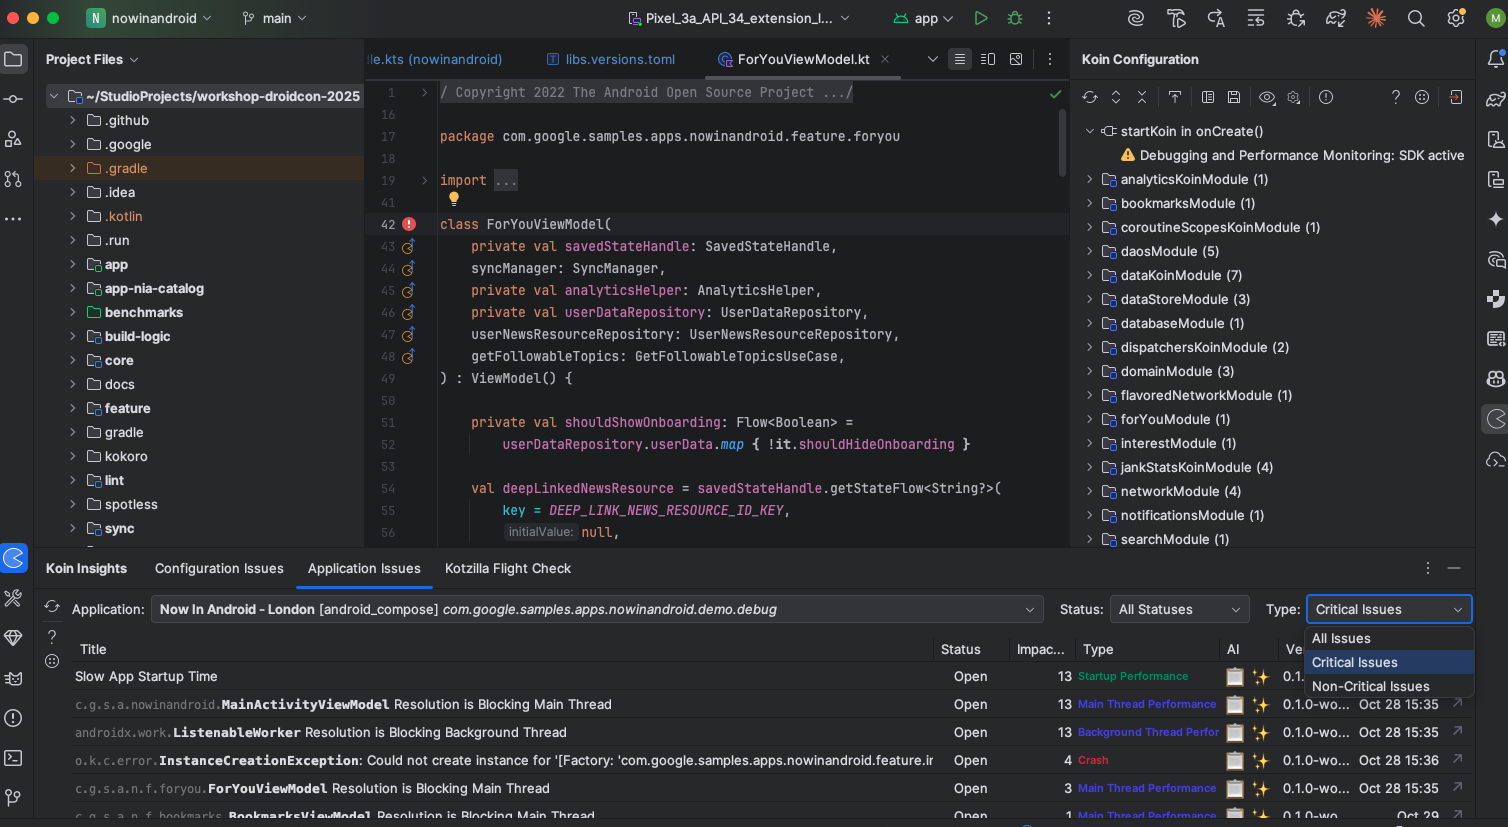
Koin IDE Plugin integration
The Koin IDE Plugin integrates with the Kotzilla Console, allowing you to view and address issues directly within your development environment. The plugin includes an Application Issues view that displays detected issues and impacted user sessions. For further investigation, you can explore issue details in the Kotzilla Console.