Detecting a background performance issue
In this tutorial, we’ll guide you through identifying background thread blockages caused by long components loading times in your app using the Kotzilla Platform.
Issue context
Background performance issues arise when background tasks consume too many resources or take too long to execute, impacting app responsiveness and overall performance.
Why it matters?
Inefficient background processing can drain device resources, slow down the app, and lead to a poor user experience.
Suggested user resolution actions
To fix thread blockages, monitor and reduce any time-consuming component or dependency resolution that take more than 100 ms on background threads.
- Profile background tasks: Use the Kotzilla Platform to analyze and optimize background operations, ensuring they run efficiently.
- Use proper threading: Implement background operations using optimized threading strategies like
WorkManagerorCoroutinesin Kotlin. - Resource management: Limit resource-intensive tasks and use efficient scheduling mechanisms to avoid excessive resource consumption.
- Efficient scoping: Use Koin’s scoping features to manage background tasks efficiently, ensuring they are only active when necessary.
Prerequisites
In this tutorial, we will be using the NowInAndroid app as an example. Before you begin, ensure you've completed the first two steps of the Get started with Kotzilla Platform
Step 1- Simulate a blockage in a background thread
We’ll simulate a background thread blockage by introducing a 1-second delay in the SyncWorker class. This will let us observe how thread blockages impact the app’s performance, even in background tasks.
Here’s the code to introduce a 1-second delay in the SyncWorker:
class SyncWorker(
    private val appContext: Context,
    workerParams: WorkerParameters,
    private val niaPreferences: NiaPreferencesDataSource,
    private val topicRepository: TopicsRepository,
    private val newsRepository: NewsRepository,
    private val searchContentsRepository: SearchContentsRepository,
    private val ioDispatcher: CoroutineDispatcher,
    private val analyticsHelper: AnalyticsHelper,
    private val syncSubscriber: SyncSubscriber,
) : CoroutineWorker(appContext, workerParams), Synchronizer {

    init {
        // Simulate slow worker
        Thread.sleep(1000)
    }
Step 2- Create user sessions to capture app execution data.
With the simulated delay added, create a user session that will allow the Kotzilla SDK to capture and display the issue.
Run the Now In Android app as described in this guide to simulate a repeatable sequence of interactions. Repeat this three times to create consistent data on Kotzilla Platform.
Step 3- Investigate root cause of issues
With the simulated 1000ms delay in the background thread, the Kotzilla Platform automatically detects a background performance issue, as the SyncWorker is taking longer than 100ms to resolve its tasks.
3.1 View issues in the Koin IDE Plugin
- Open the Issues Panel in the Koin IDE Plugin.
- Navigate to the Application Issues section.
- You should see a detected issue for
SyncWorkerresolution that is blocking background thread execution
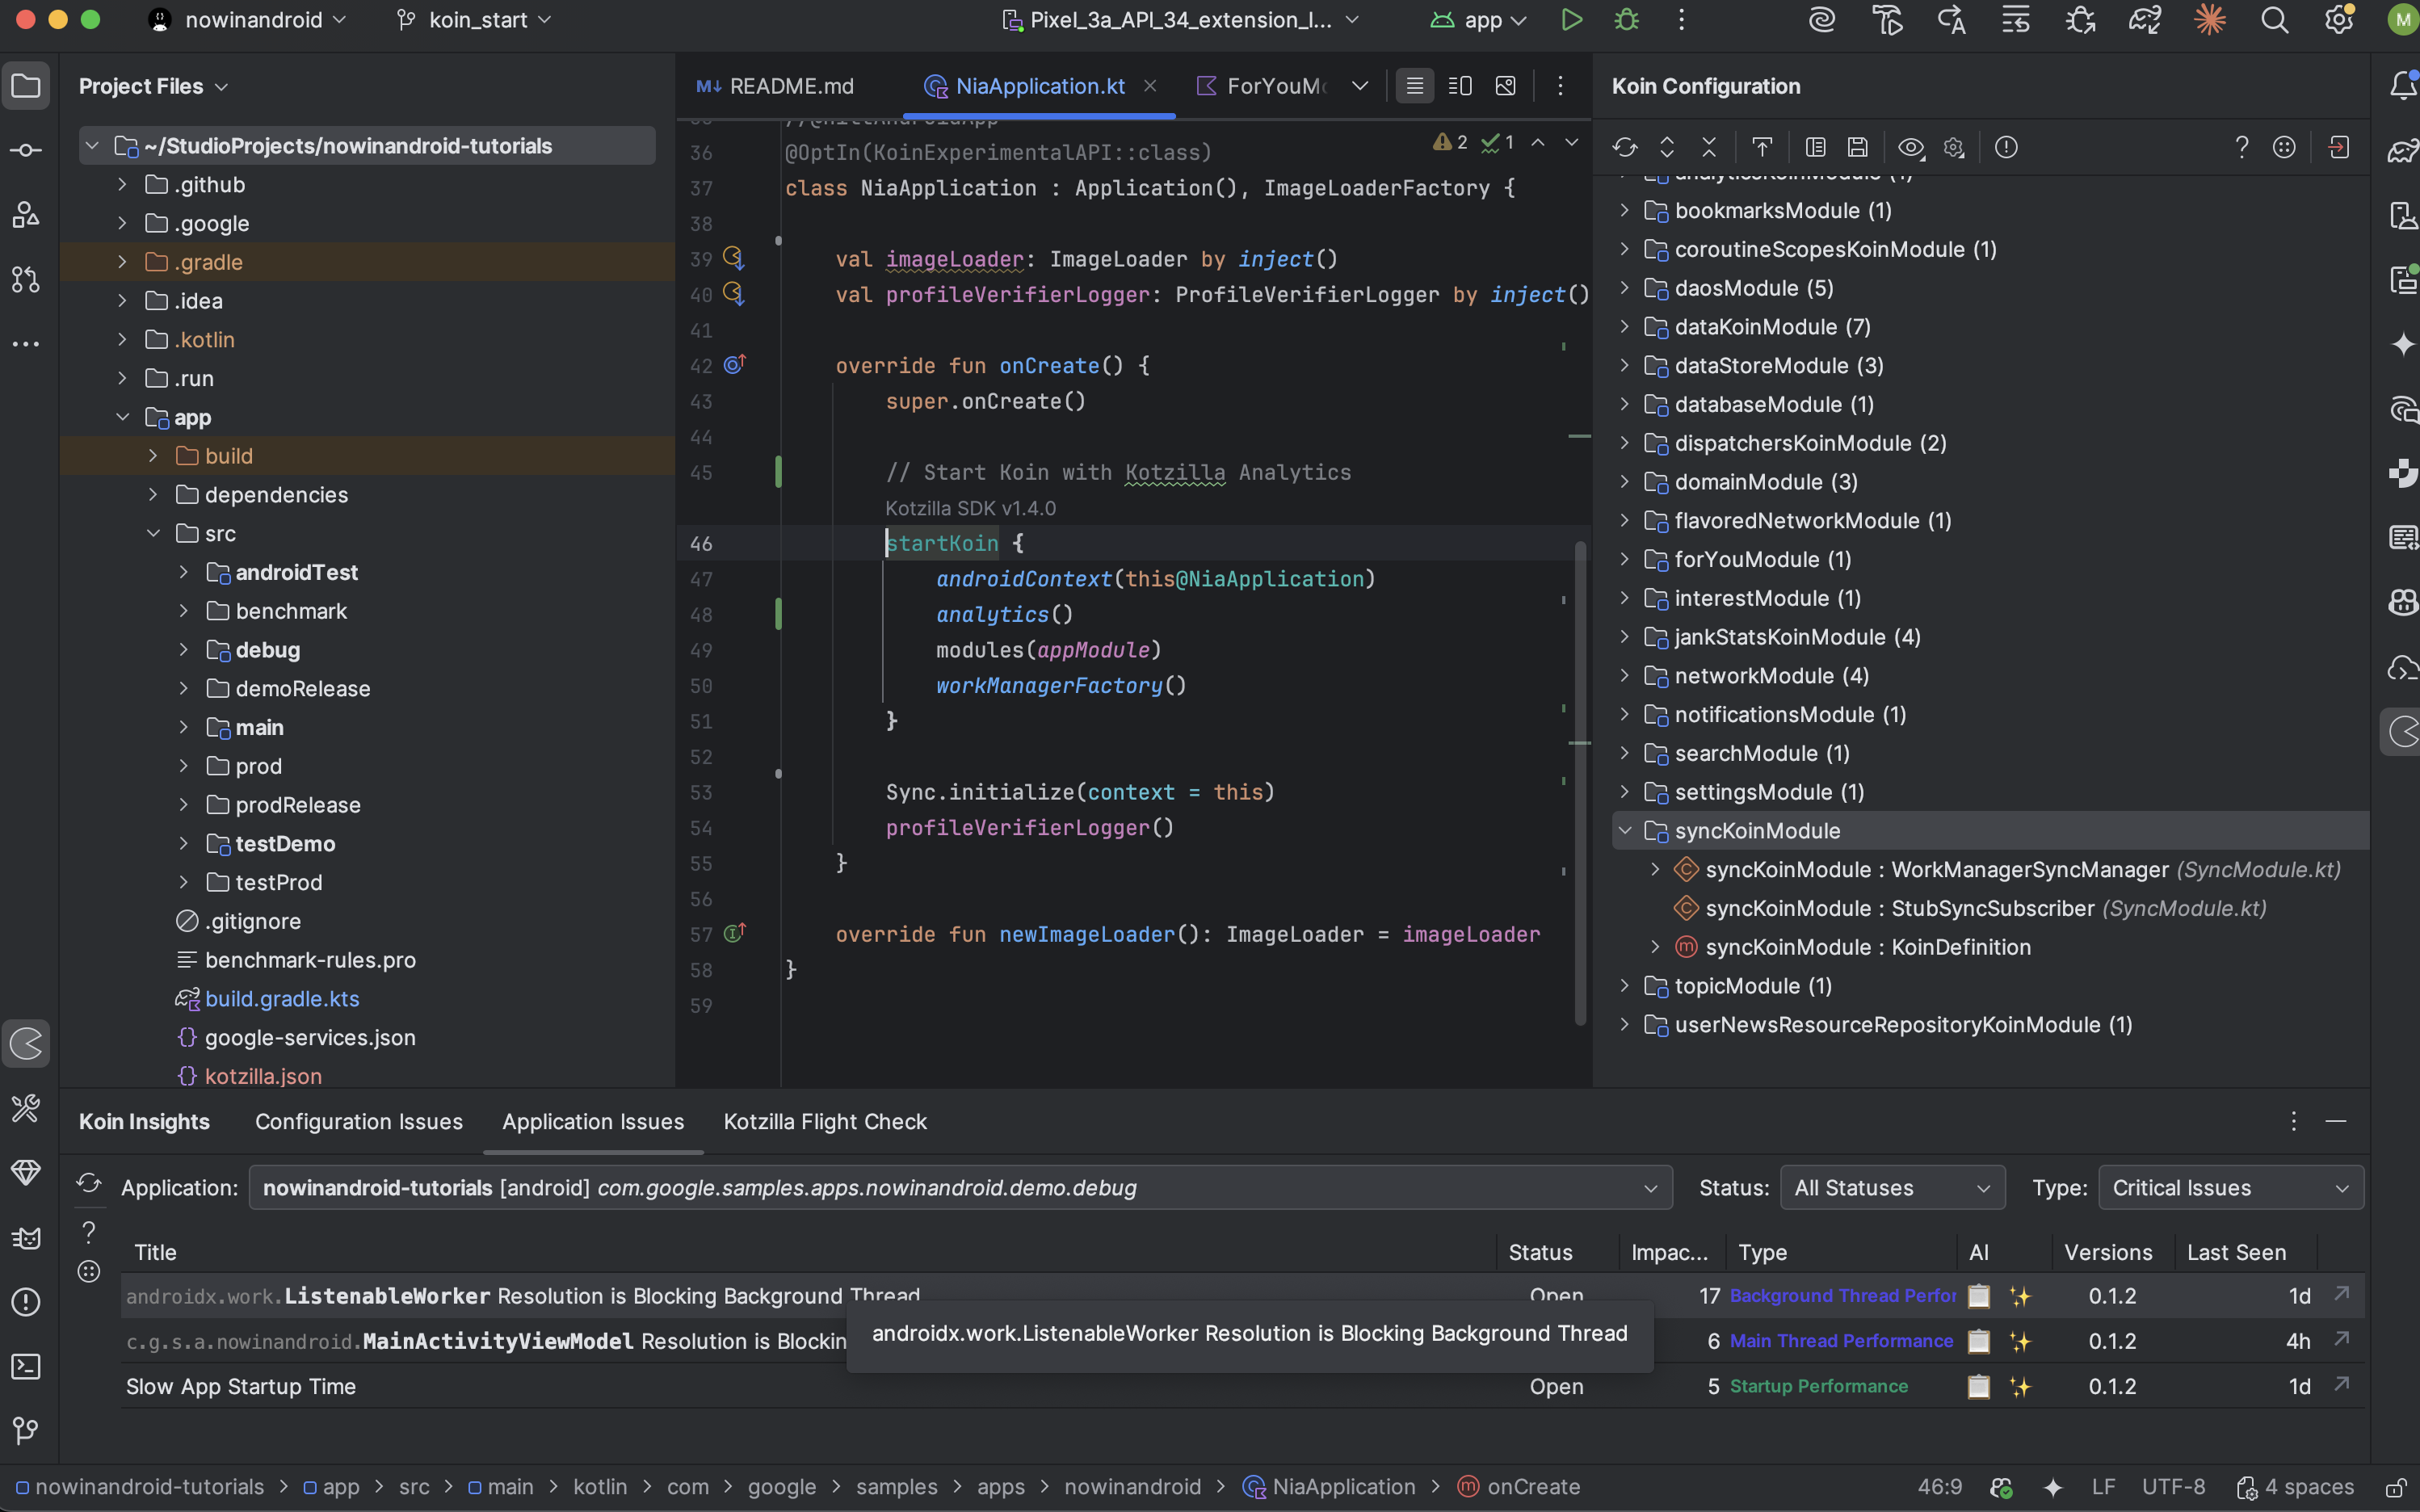
3.2 Investigating the root cause of issues
To investigate the details of this issue double-click on the
ListenableWorker Resolution is Blocking Background Thread issue in the Koin IDE Plugin. This will redirect you to the Issue Details view in the Kotzilla Console.
Here, you will see:
- A list of 3 impacted user sessions.
- A detailed description of the issue, including that the
ListenableWorkerresolution is running on background thread for more than 100 ms
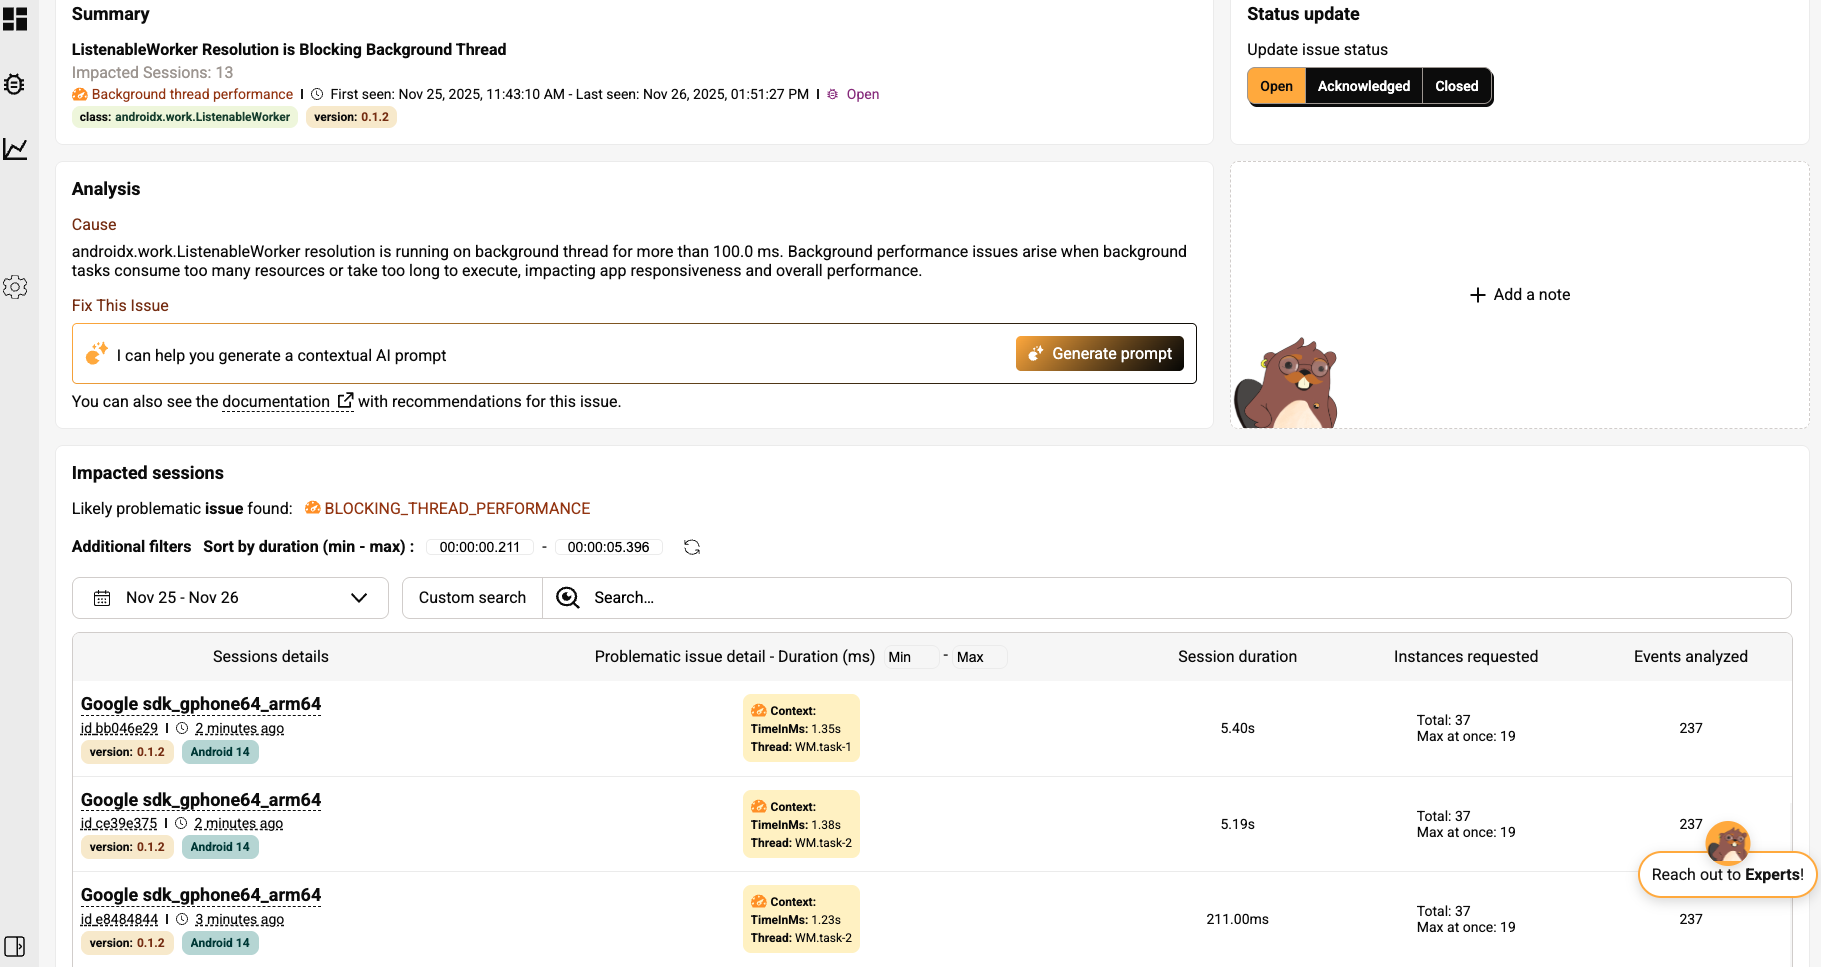
3.3 User session analysis to trace the background thread blocage
Click on the first impacted user session to drill down into the specific events and components related to the issue. This will take you directly to the Timeline View, where you will observe:
- The SyncWorker is blocking a background thread for more than 1,35s.
- Several dependencies tied to the SyncWorker have performance issues due to delayed task resolution.
- The WM.task-1 thread performance is impacted by the complexity of the dependency graph, with 19 dependencies involved in the background task resolution.
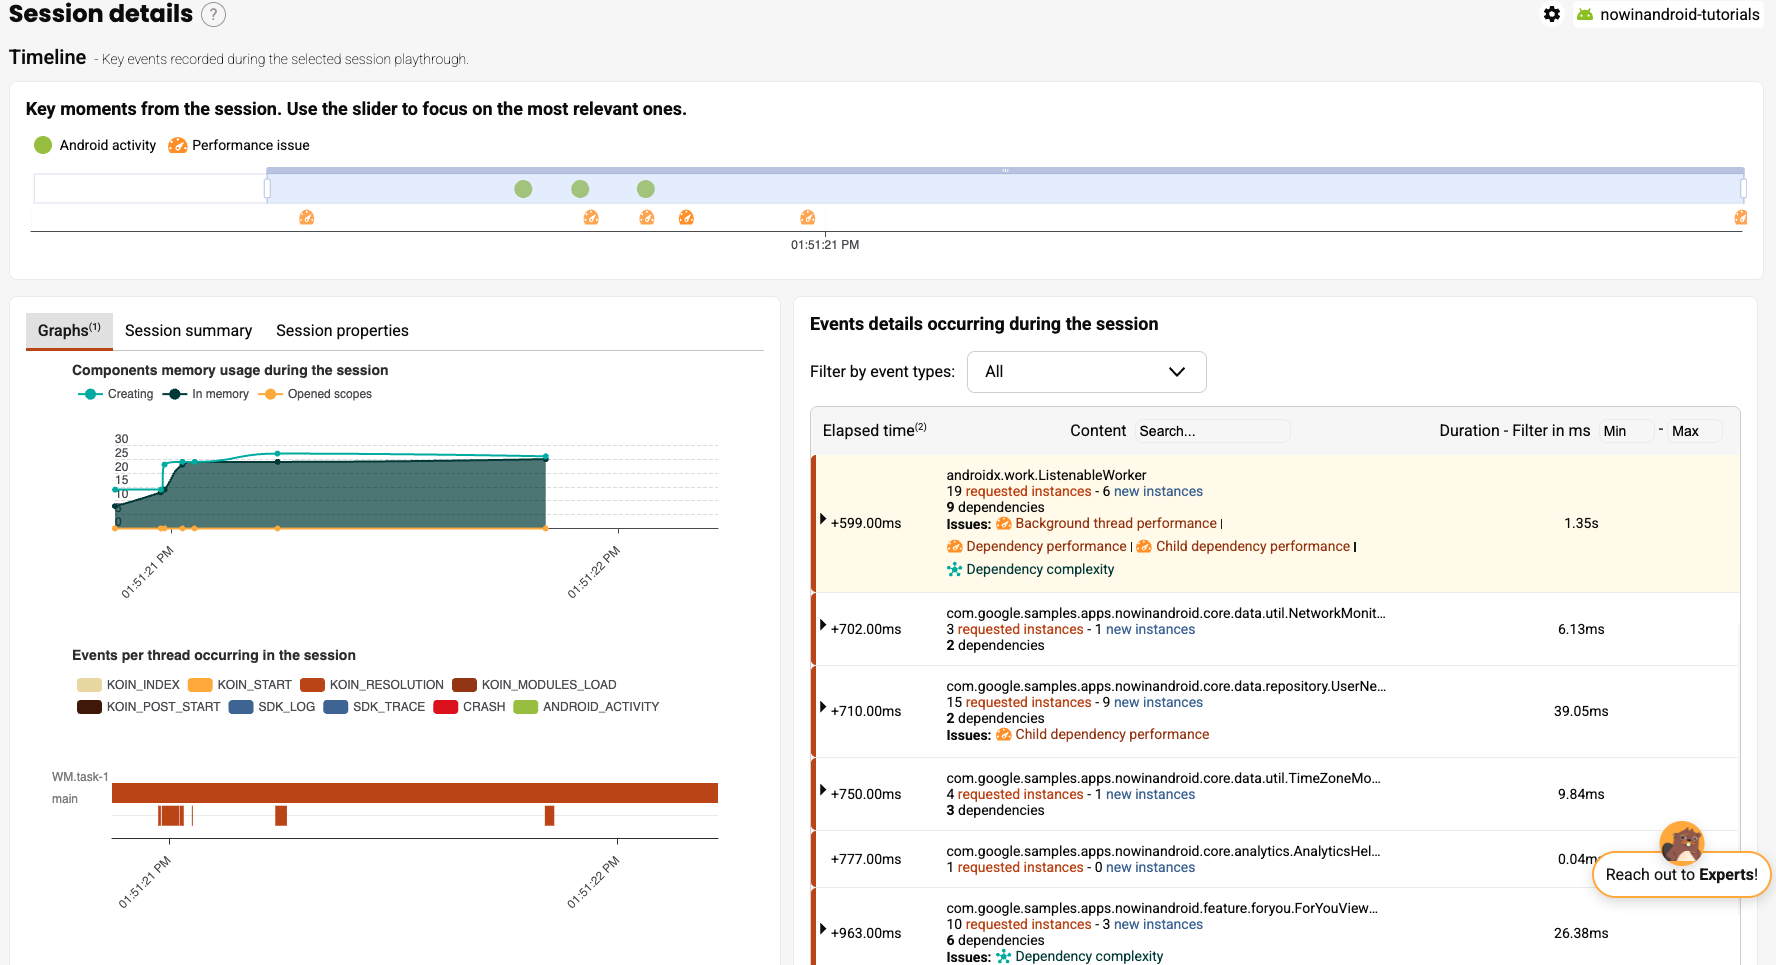
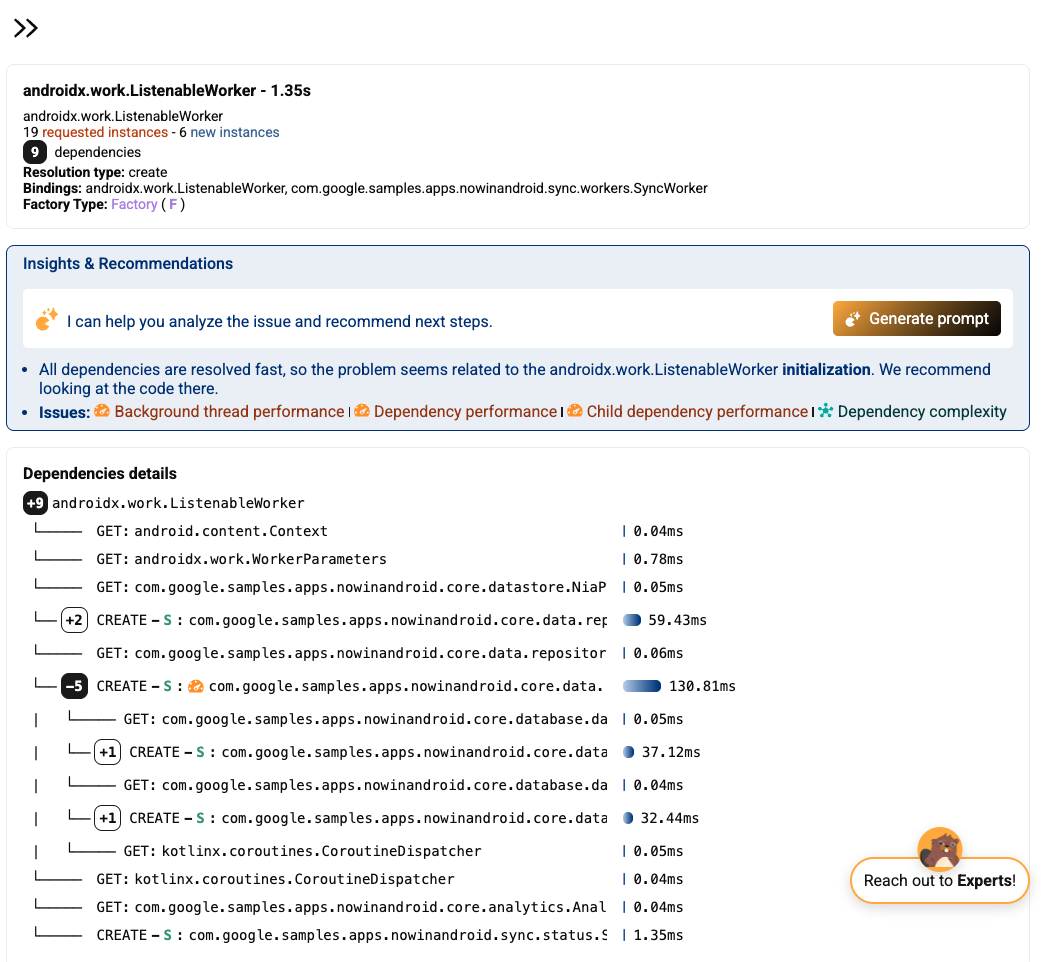
Click on the ListenableWorker in the event sequence. The tree graph view will display all child nodes involved in the worker’s resolution. In this case, we observe that one dependency takes over 130ms to resolve, so it deserves attention; however, the majority of the total 1.35s execution time is spent in the worker’s initialization logic.
Step 4- Fix a slow app startup issue
If you’re using an AI coding assistant in your workflow, the most accurate path is the Kotzilla MCP Server, which lets the assistant query live context from the Kotzilla Platform and apply fixes directly. Prompt generation from the Koin IDE Plugin or Kotzilla Console is also supported if you prefer a copy-paste flow.
Otherwise, you can follow our recommended manual steps
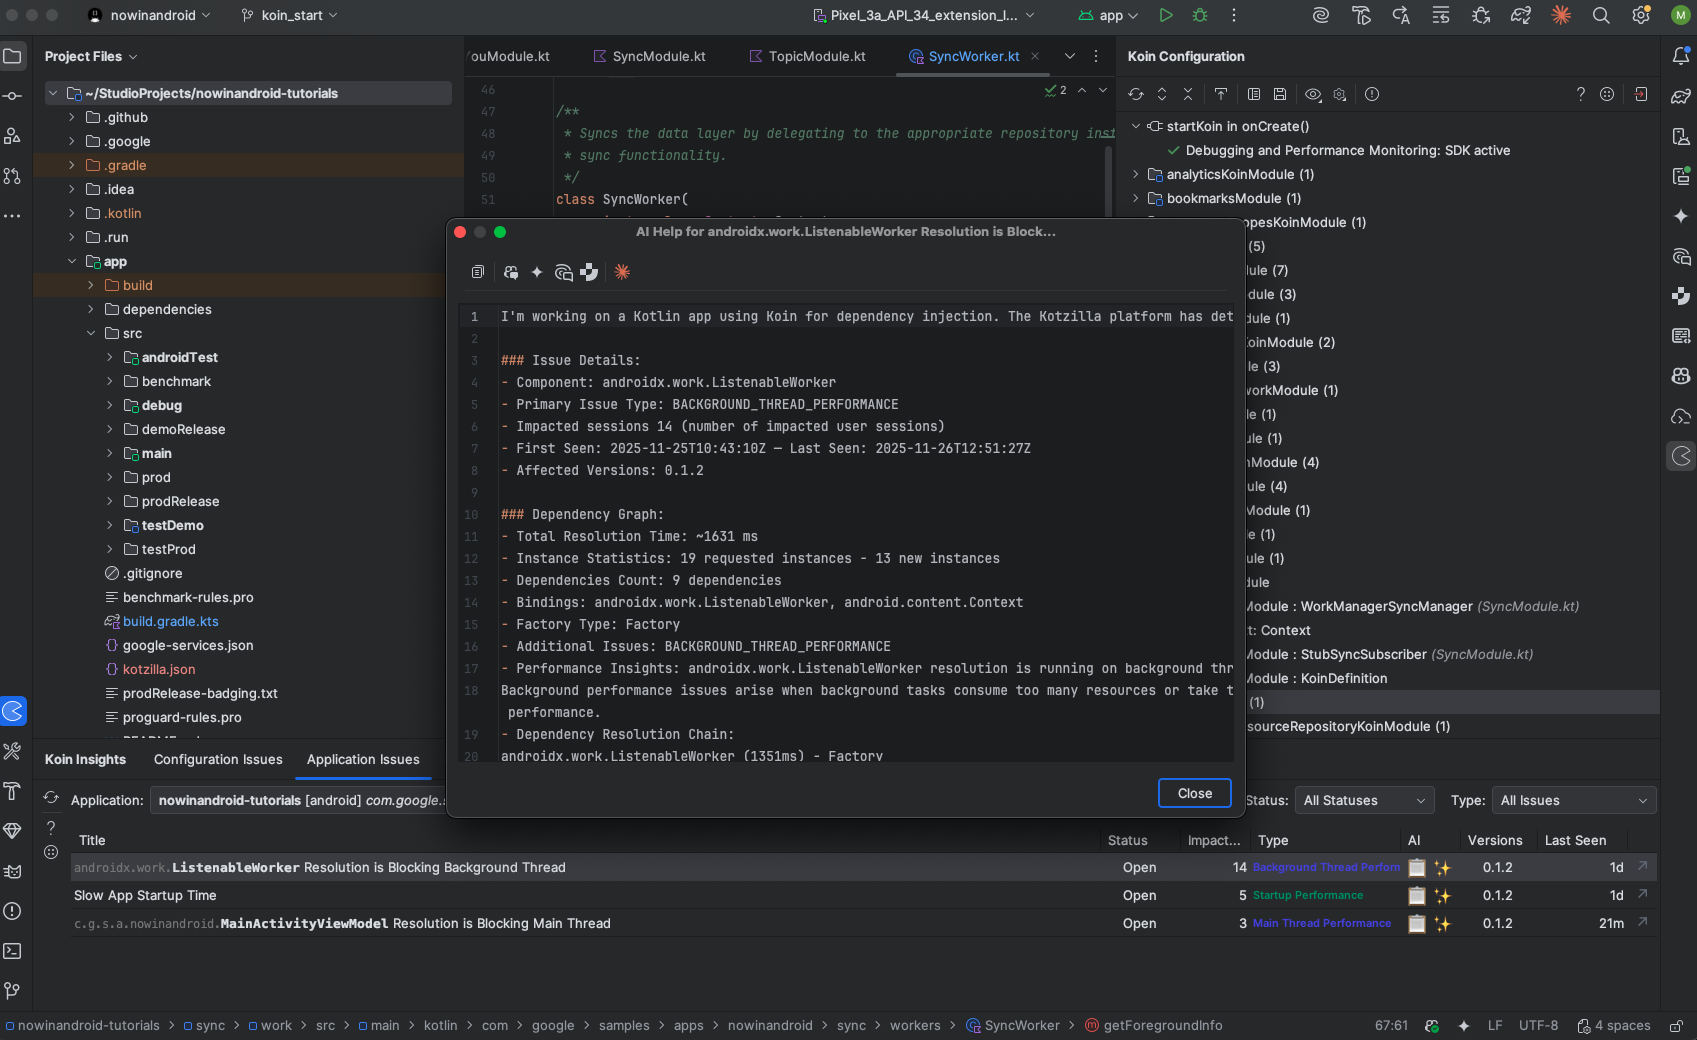
4.1 Generate a contextual prompt for the issue
You can generate contextual fix prompts either from the Koin IDE Plugin or directly from the Kotzilla Console. In this example, we’ll use the IDE Plugin to create the prompt and execute it with your AI coding assistant:
- Open the Application Issues tab of the Koin IDE Plugin in your Android Studio
- Select the issue
ListenableWorker Resolution is Blocking Background Thread - Click on the AI icon on the right to generate and view the prompt
The plugin will generate a ready-to-use prompt with all the necessary context so your AI coding assistant can suggest fixes. Each prompt includes the impacted components, dependency chains, and performance insights.
4.2 Execute the fix with your preferred AI Coding Assistant
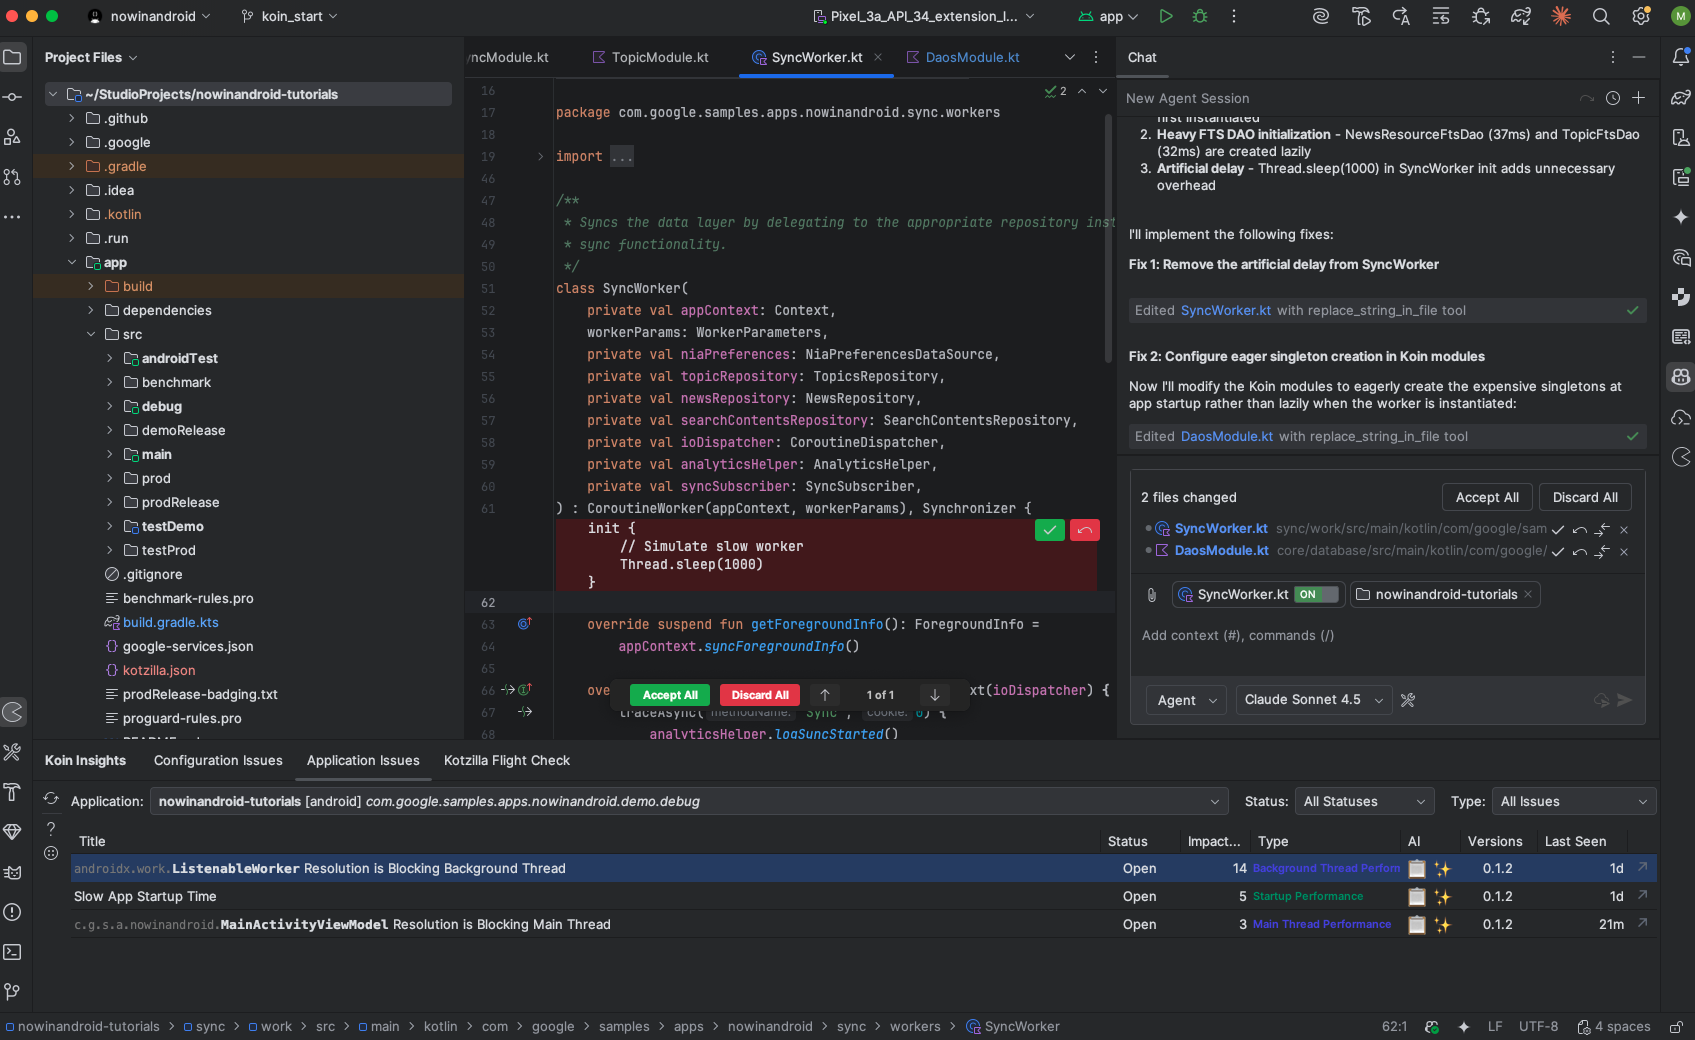
You can now copy the generated prompt and execute it using the AI Coding Assistant of your choice in the IDE. In this example, we use GitHub Copilot with the Claude Sonnet 4.5 model:
- Open your AI assistant panel (i.e, Copilot Chat)
- Paste the generated prompt
- Run it with Agent Mode (or equivalent), so the assistant can apply code changes directly with full project context
- Review and approve the changes suggested by the assistant
Key takeaways
By simulating a 1-second delay in SyncWorker, we observed how background thread blockages can slow down background task execution and affect overall app performance. Using Kotzilla Platform and the Koin IDE Plugin, we identified the slow dependency, examined impacted sessions, and traced the majority of the delay to the worker’s initialization logic.
Once detected, the issue can be addressed using Kotzilla’s contextual prompts with your AI coding assistant or by applying manual optimization steps. Improving worker initialization and resolving slow dependencies helps reduce background thread blocking, leading to more responsive app behavior and smoother user experience.