Detecting a child dependency performance issue
In this tutorial, we’ll guide you through identifying a child dependency performance issue within your app that may be slowing down the overall performance using the Kotzilla Platform.
Issue context
In Koin, components often depend on other services or objects. If a child dependency (a dependency used within another component) is poorly optimized or slow, it can create a performance bottleneck, affecting the entire component hierarchy
Why it matters?
A single slow child dependency can cause:
- Cascading performance issues: if a key dependency (i.e, a repository or data source) is slow, every feature that relies on it will experience slowdowns.
- Blocked main thread execution: if the slow dependency is resolved on the main thread, it can cause UI delays and poor app responsiveness.
- Difficult to isolate bottlenecks: the impact may not appear directly in logs but surfaces in the parent component that depends on the slow service.
Suggested user resolution actions
To fix child dependency performance issues, monitor and optimize any dependency resolution exceeding 5 ms per call:
- Profile slow dependencies: Use the Kotzilla Platform to detect long resolution times in the dependency graph.
- Reduce resolution time: Optimize child dependencies to avoid cascading delays in parent components.
- Optimize Koin configurations: Use single instead of factory where appropriate to reduce unnecessary re-initialization.
- Refactor dependencies: Break down complex services into smaller, focused components to simplify execution logic.
Prerequisites
In this tutorial, we will be using the NowInAndroid app as an example. Before you begin, ensure you've completed the first two steps of the Get started with Kotzilla Platform
Step 1 - Simulate a slow component resolution
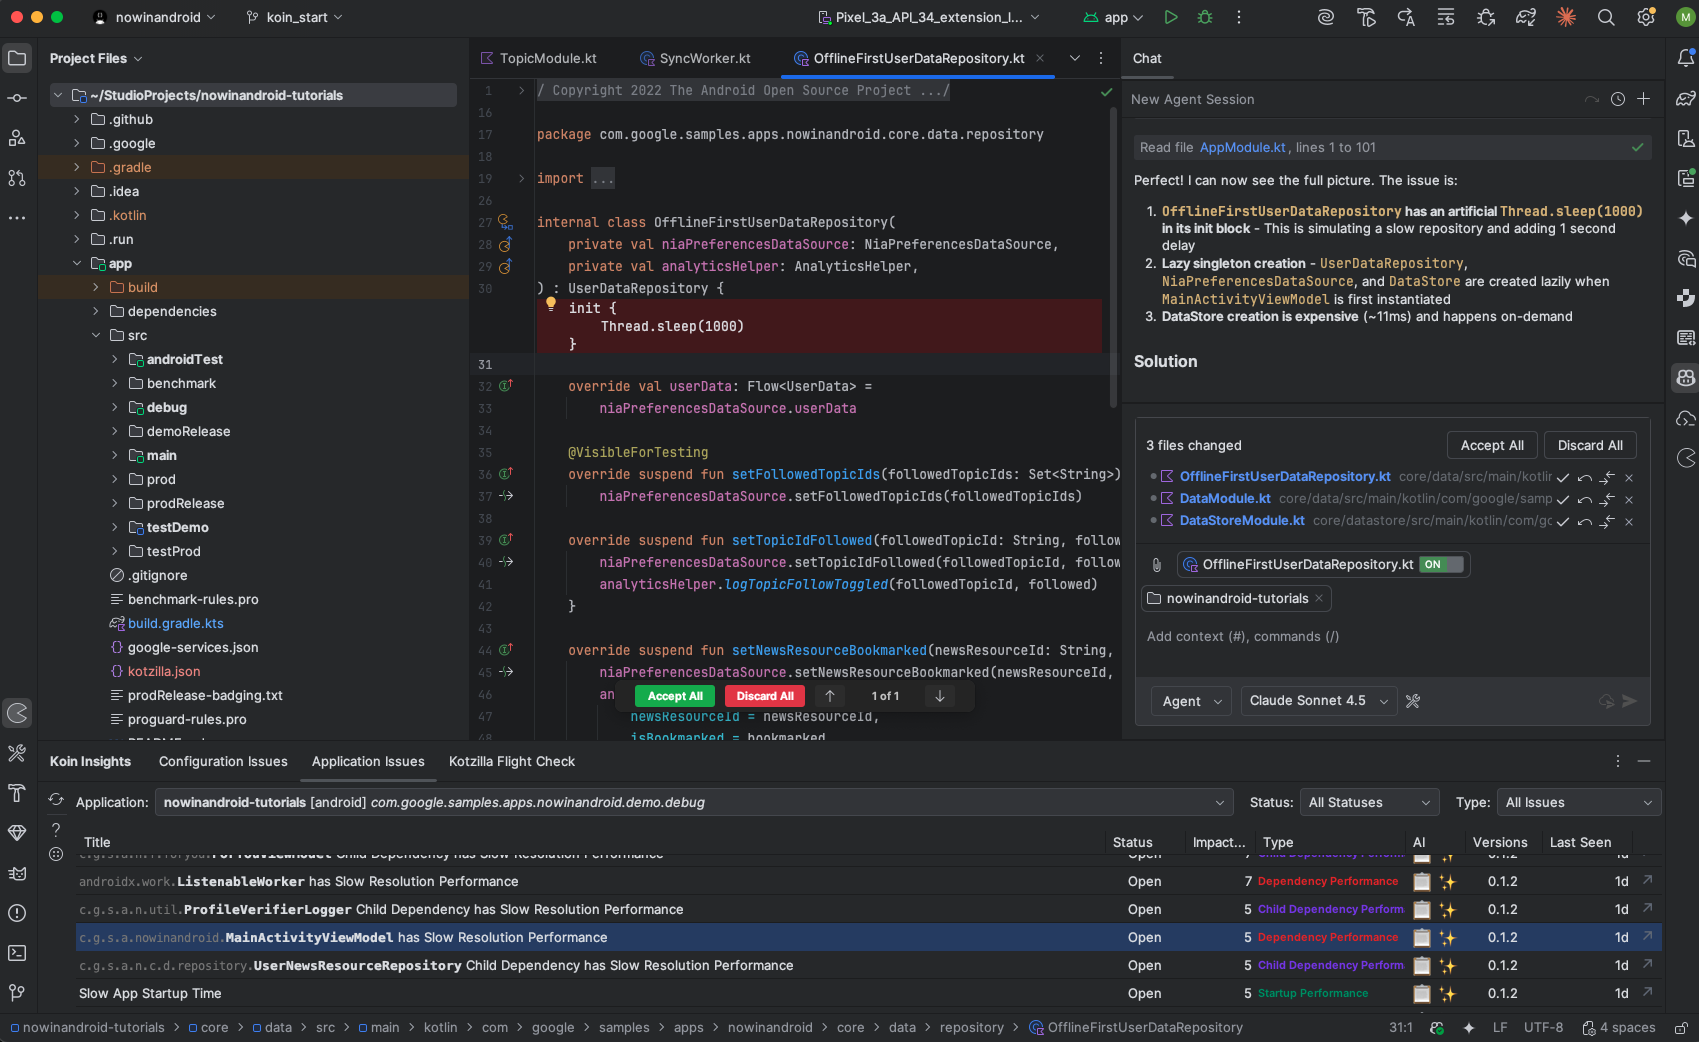
We will simulate a delay in the constructor of the OfflineFirstUserDataRepository, which is a key dependency within the app. This delay will help us observe the impact of slow child resolution on the app’s performance.
Here’s the code to introduce a 1-second delay in the OfflineFirstUserDataRepository:
internal class OfflineFirstUserDataRepository(
    private val niaPreferencesDataSource: NiaPreferencesDataSource,
    private val analyticsHelper: AnalyticsHelper,
) : UserDataRepository {

    // Simulate a slow dependency resolution with a 1-second delay
    init {
        Thread.sleep(1000)
    }
Step 2 - Create user sessions to capture execution data
Once the delay is introduced in the component, create user sessions to capture data about how the slow initialization impacts the app. Repeat this process three times to gather consistent performance data.
Run the Now In Android app as described in this guide to simulate a repeatable sequence of interactions. Repeat this three times to create consistent data on Kotzilla Platform.
Step 3- Investigate root cause of issues
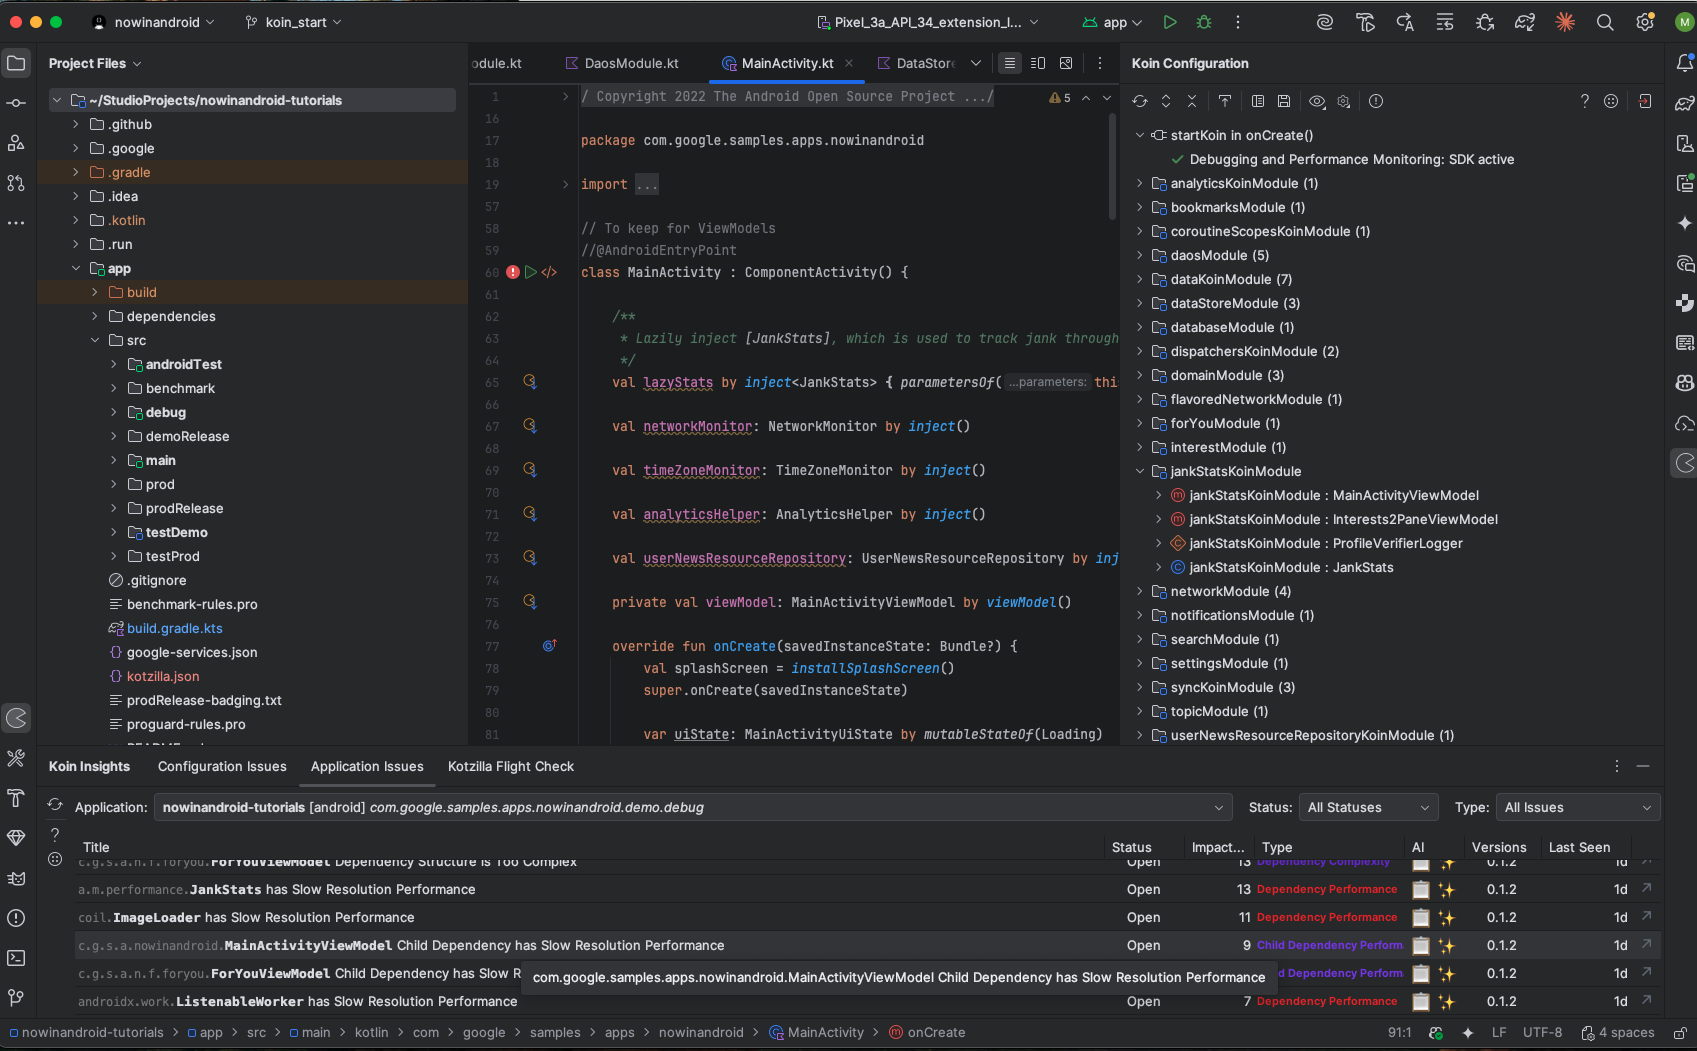
With the simulated delay in place, we will use the Koin IDE Plugin to visualise dependency resolution issues detected by the platform and affecting the performance. Open the Issues Panel in the Koin IDE Plugin and navigate to the Application Issues section.
You should see different issues including
- Dependency performance impacting
MainActivityViewModel MainActivityViewModelslow resolution blocking the main ThreadMainActivityViewModelchild dependency has slow resolution performance
3.2 Investigating the root cause of issues
To investigate the details of this issue double-click on the
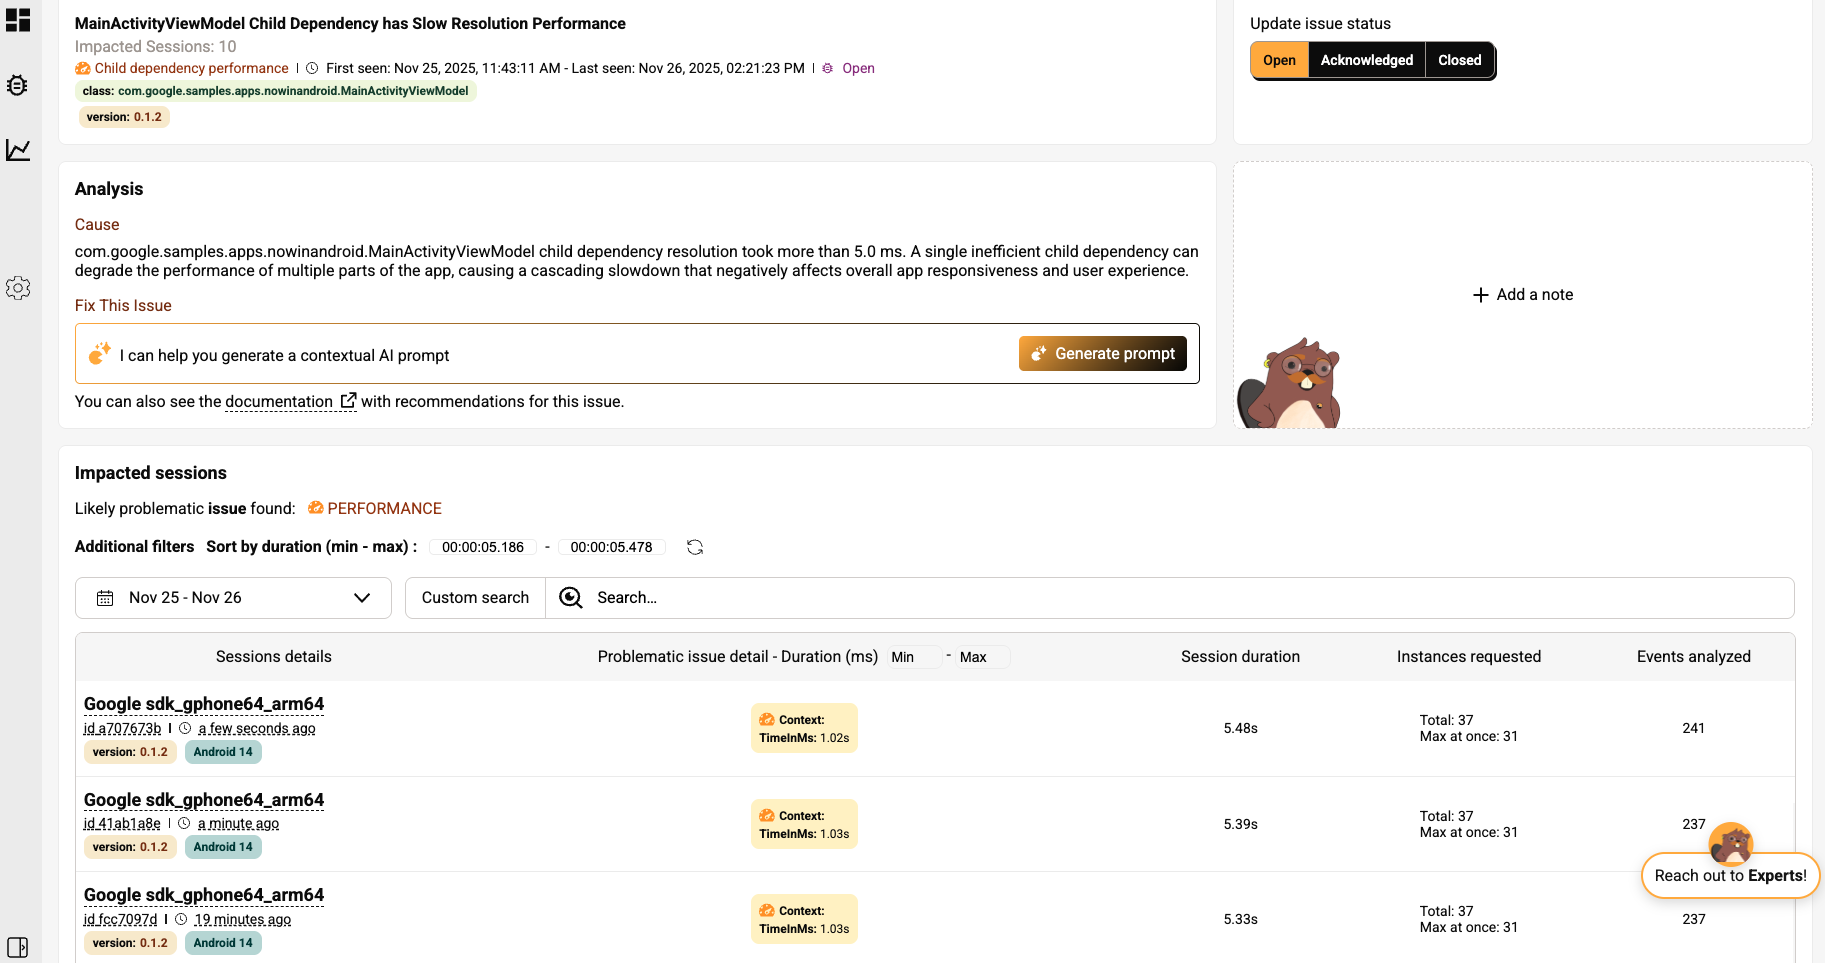
MainActivityViewModel child dependency has a slow resolution performance issue in the Koin IDE Plugin. This will redirect you to the Issue Details view in the Kotzilla Console.
Here, you will see:
- A list of 3 impacted user sessions.
- A detailed description of the issue, including that the
MainActivityViewModelhas a slow dependency resolution that is taking more than 5ms.
3.3 User session analysis to trace a slow child dependency resolution
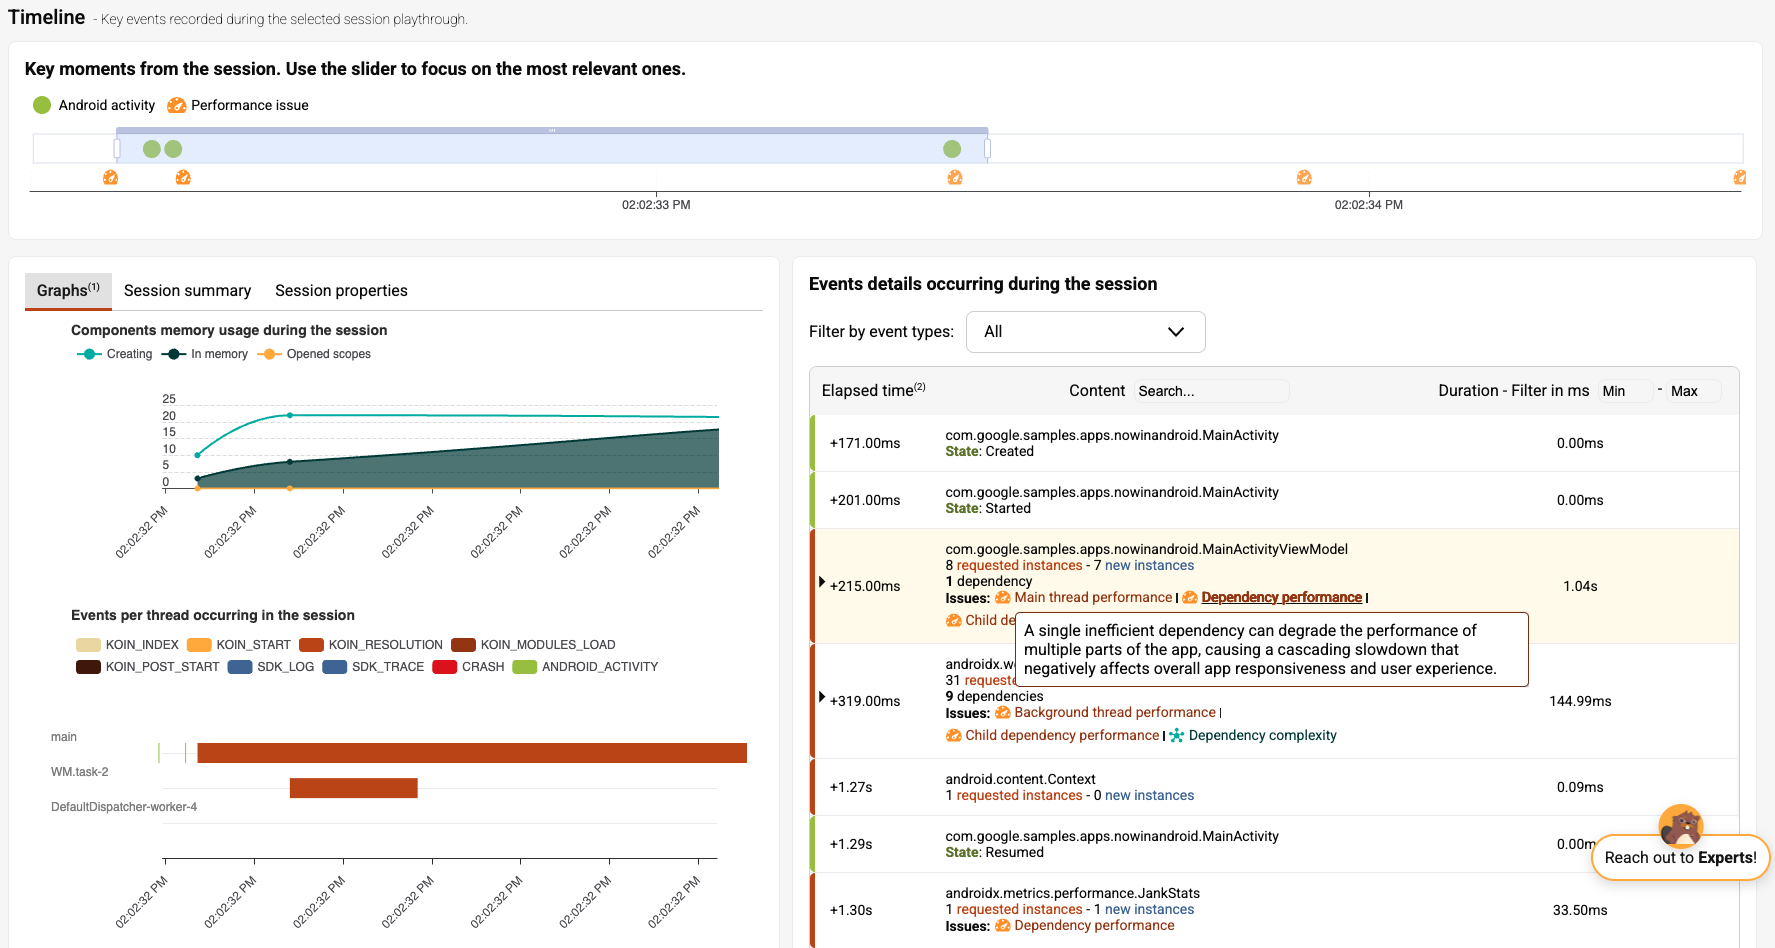
Click on the first impacted user session to drill down into the specific events and components related to the issue. This will take you directly to the Timeline View, where you will observe:
- The
MainActivityViewModelis blocking the main thread for over 1s. - The 1-second delay can be seen during the screen lifecycle transitions, especially between the started and resumed states, causing the main thread to be blocked.
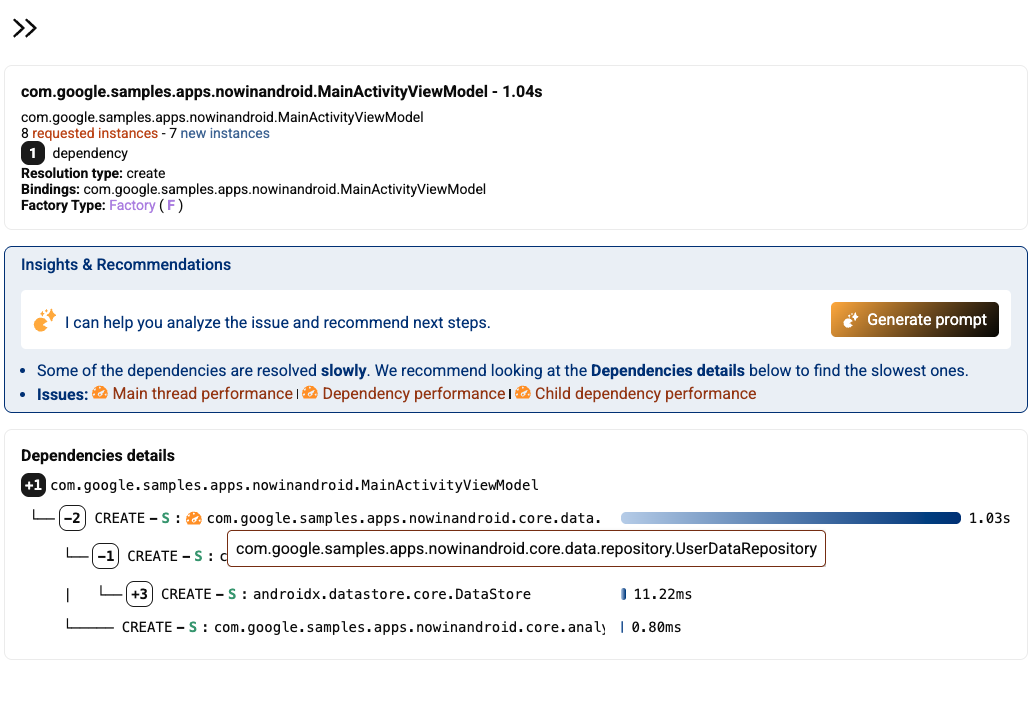
Click on the MainActivityViewModel in the event sequence. The tree graph view will display all child nodes involved in the resolution. Most of the time is spent within the UserDataRepository.
While we don’t see the OfflineFirstUserDataRepository directly in the graph, the delay is being inherited through the UserDataRepository interface.
Step 4- Fix a slow child dependency resolution issue
If you’re using an AI coding assistant in your workflow, the most accurate path is the Kotzilla MCP Server, which lets the assistant query live context from the Kotzilla Platform and apply fixes directly. Prompt generation from the Koin IDE Plugin or Kotzilla Console is also supported if you prefer a copy-paste flow.
Otherwise, you can follow our recommended manual steps
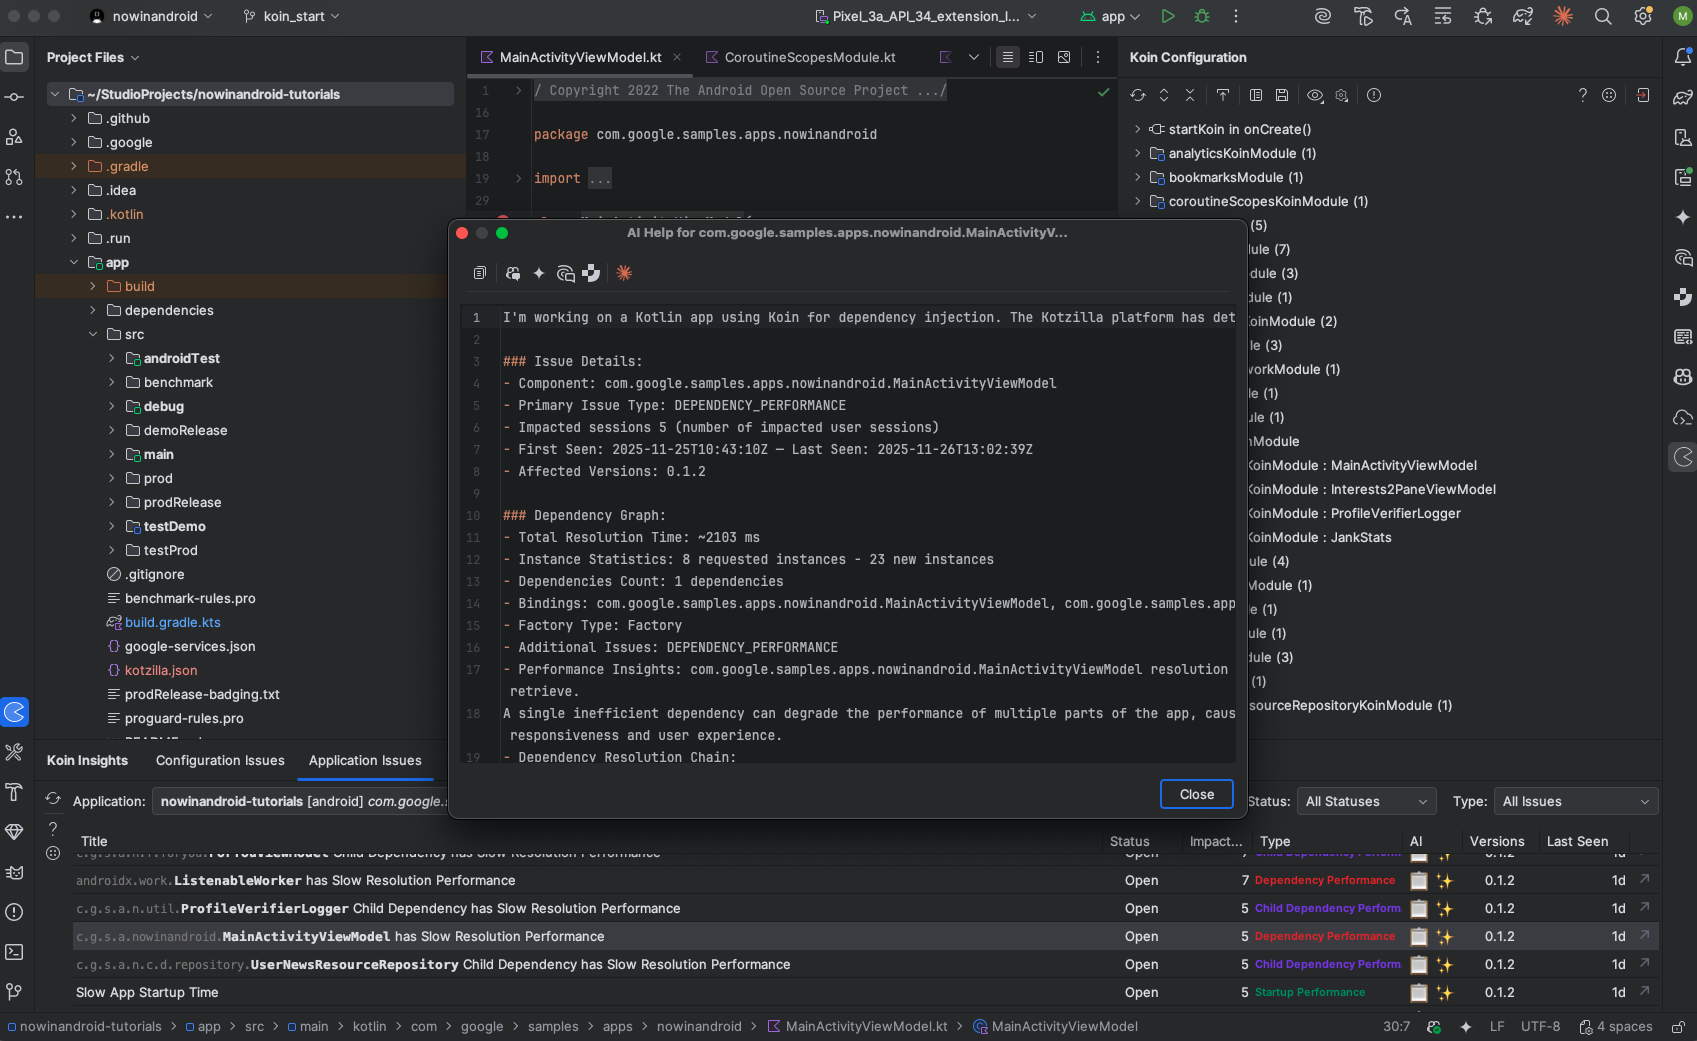
4.1 Generate a contextual prompt for the issue
You can generate contextual fix prompts either from the Koin IDE Plugin or directly from the Kotzilla Console. In this example, we’ll use the IDE Plugin to create the prompt and execute it with your AI coding assistant:
- Open the Application Issues tab of the Koin IDE Plugin in your Android Studio
- Select the issue
MainActivityViewModel Child Dependency has Slow Resolution Performance - Click on the AI icon on the right to generate and view the prompt
The plugin will generate a ready-to-use prompt with all the necessary context so your AI coding assistant can suggest fixes. Each prompt includes the impacted components, dependency chains, and performance insights.
4.2 Execute the fix with your preferred AI Coding Assistant
You can now copy the generated prompt and execute it using the AI Coding Assistant of your choice in the IDE. In this example, we use GitHub Copilot with the Claude Sonnet 4.5 model:
- Open your AI assistant panel (i.e, Copilot Chat)
- Paste the generated prompt
- Run it with Agent Mode (or equivalent), so the assistant can apply code changes directly with full project context
- Review and approve the changes suggested by the assistant
Key takeaways
By simulating a 1-second delay in OfflineFirstUserDataRepository, we reproduced a slow child dependency resolution and observed how it propagates to MainActivityViewModel, blocking the main thread and slowing down screen transitions. Using the Kotzilla Platform and Koin IDE Plugin, we analyzed impacted sessions, visualized the dependency tree, and pinpointed which child dependencies caused the performance bottleneck.
You can then fix the issue using Kotzilla’s contextual prompt generation with your AI coding assistant, or follow recommended manual actions. Optimizing this single child dependency leads to faster dependency resolution, smoother screen transitions, and an overall improved user experience.